Build Alpha and Python

As 2017 comes to an end, I want to introduce one more upgrade to BuildAlpha in its first year. As you know Build Alpha allows users to create, stress test, and even generate tradable code without ANY programming at all.
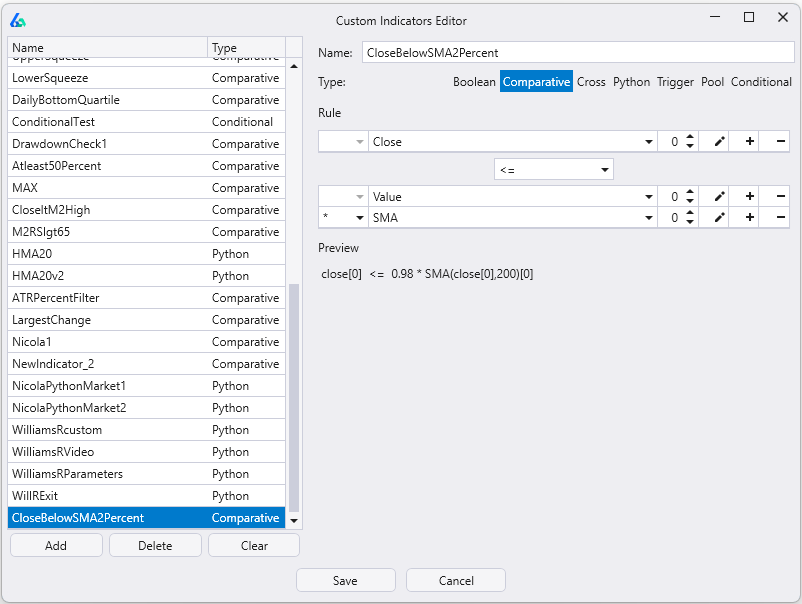
It also allows traders to use a custom drag and drop signal builder to create unique rules and signals to test alongside the pre-built Build Alpha signal library of nearly 5,000 signals – and growing (below is a picture of the drag and drop custom signal builder).
Build Alpha Custom Indicator Editor 2

However, I have now added a python environment to give traders even more freedom. Traders now have the ability to code their own signals in python and optimize these signals in the Build Alpha strategy creation engine.

Again, you do NOT need ANY programming skills to use Build Alpha but if you WANT to you can now use python to create signals, but you do NOT have to as Build Alpha will work without. This is just an upgrade for the more sophisticated traders out there.

Python Example in Build Alpha

Below is a simple, step-by-step walkthrough of how to create a signal using python and test it with other pre-built signals in Build Alpha. 

Step One: File >> Custom Indicator Editor

This step opens the custom indicator editor pictured above. 
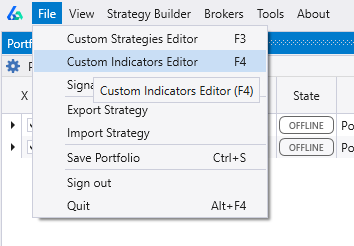
File Custom Indicator Editor Menu Option

Step Two: Add new indicator and select Python

In the lower left of the new window that opens, please select Add and then near the top of the interface please click on Python. Both of these are circled in red below.
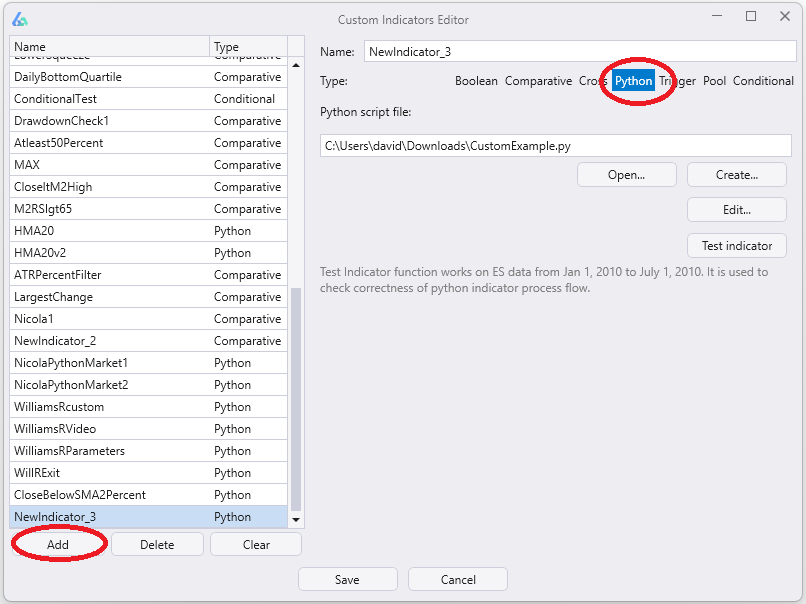
Add Python Indicator to Custom BA Editor

Step Three: Create and save the file

Hit the Create button which will open your File Explorer. Name the file that will contain your custom python script and select an appropriate file location to save the file. 

You can also give your indicator a name in the top Name input box. Please note that this is the name that will appear in the main Build Alpha signal selection window.

In the example below I’ve named my custom python indicator “MyCustomIndicatorName” (green box) and named the file “CustomExample.py” (lower red box) while saving to my File Explorer. 
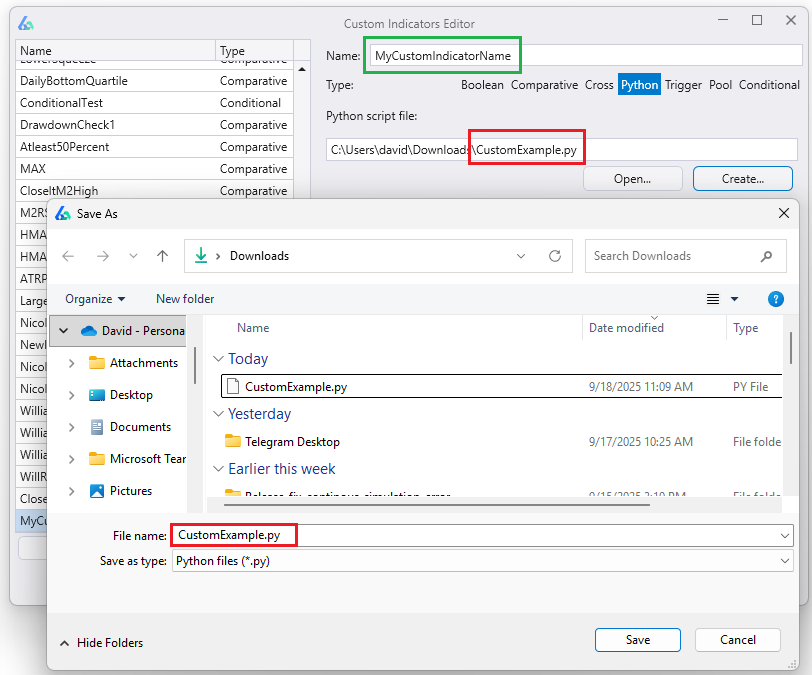
Custom Indicator Name

Step Four: Add your code and save

Build Alpha then produces a simple to use template and we just need to add our custom code in the GetCustomSignal function. I have added a small moving average example below.
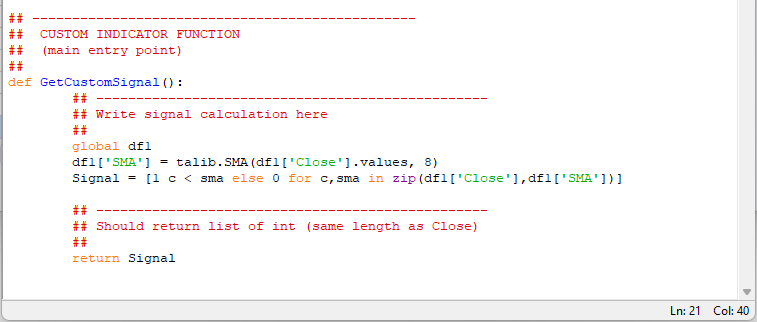
The only requirement is that we return a Signal list with the same length as data rows in our input data. That is, we must have a true or false signal for every bar. Do not drop NaNs. 

Step Five: Custom Parameters

Build Alpha also supports custom parametric python signals. We can add variables between these comment sections like this
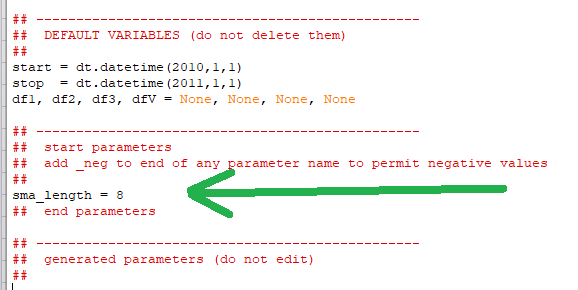
Custom Indicator Python Parameter Variable

Then edit your code in the GetCustomSignal function to utilize your new parameter variable. Here is mine edited below. Notice I have removed the magic number 8 and replaced it with the sma_length variable which stores the value 8 at the moment.
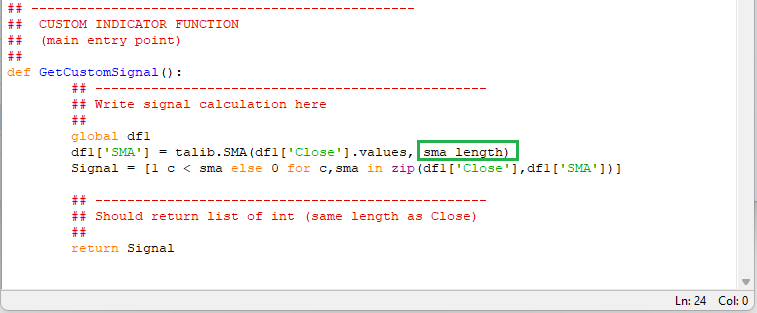
Custom Indicator Python Parameter Replaced

Now save your custom python script and hit Save on the Build Alpha Custom Indicator Editor window. The indicator is now saved and will appear in your Custom Signals list of the main Strategy Builder interface.

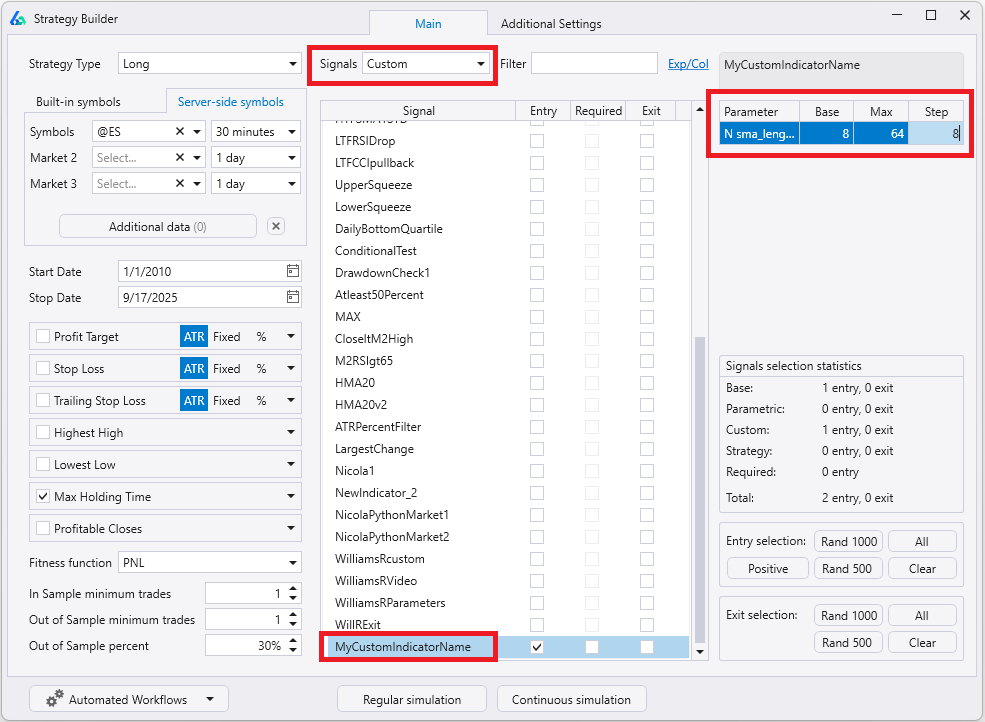
If you click on your custom signal in the Strategy Builder you will now see the ability to edit the parameter range for any custom parameters you have added to your python script. Below I have set to optimize mine as 8, 16, 24, 32, 40, 48, 56, 64. 
Running a simulation will then show all possible parameter variations for your custom python indicator. I set two max rules and required the second rule to be Not Sunday (always true) so each row has one variation of my custom python signal.
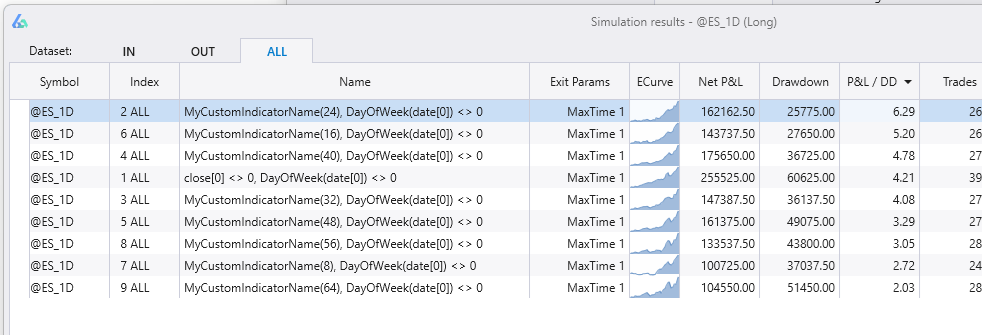
Custom Parametric Python Signals Results Window Build Alpha

This new feature opens the door for what is possible in Build Alpha. Traders can leverage the power of python as well as BuildAlpha in extremely easy to use ways.

Installing Python Libraries for Build Alpha

Build Alpha’s python environment is a full python environment which means we can import any external python libraries. The above example imported the famous technical analysis library, talib, to create a moving average trading strategy with python.
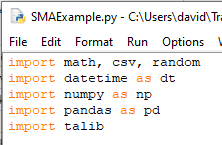
You can add any external python library. The Build Alpha python installer includes talib, sci-kit learn, scipy, matplotlib and many other essentials.

Install Python Library for Technical Analysis Indicators

If you do not have talib installed or want to add a new python library, then open a command terminal and navigate to your python directory.

You can type ‘cmd’ into the start menu of most Windows devices. If you used the Build Alpha installer then talib is included. However, you can navigate to your python directory like this below:
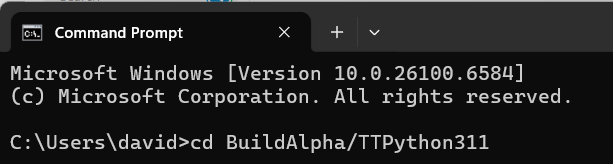
Please note you can always check the folder inside Build Alpha for the most recent version of Python. At the time of writing we are using Python 3.11 so the folder name is TTPython311.

Then install talib using the following prompt below. Notice the hyphen in ta-lib.
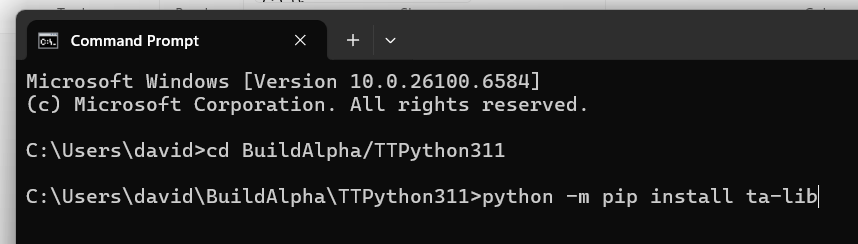
Hit <ENTER> and you have now added a new library for use in python for Build Alpha. You can import the new library to the top of any new python script and Build Alpha will recognize it.

Algorithmic Trading Python

Python is the fastest growing and most versatile programming language making it extremely attractive for quantitative traders and developers. Many algo traders prefer python due to its easy-to-read code and simple syntax. Python does not require code block brackets or semi-colons to end statements, but still is object oriented providing a great mix of ease and flexibility.
Python for algorithmic trading is growing every day with new libraries and popular libraries being updated. TALIB is the most popular library, but many more advanced libraries continue to pop up. Algo trading with python has never been easier.

However, connecting to exchanges, handling live price data, and coming up with trading ideas can be a daunting task. The best part about coding is coming up with new signals. Build Alpha takes care of the heavy lifting enabling python traders to simply do the fun part: signal creation.

Summary

Build Alpha now supports the ability to import custom signals via python. This is additional functionality for programmers that want to leverage the speed and ease of Build Alpha. Reminder that this is extra and NO programming is needed to use Build Alpha’s built-in signals or drag and drop custom signal builder.

It has been one heck of a year for Build Alpha’s development and there is still so much to do in 2018! Thanks for all those that support the software; I am looking forward to next year.

Author

David Bergstrom – the guy behind Build Alpha. I have spent a decade-plus in the professional trading world working as a market maker and quantitative strategy developer at a high frequency trading firm with a Chicago Mercantile Exchange (CME) seat, consulting for Hedge Funds, Commodity Trading Advisors (CTAs), Family Offices and Registered Investment Advisors (RIAs). I am a self-taught programmer utilizing C++, C# and python with a statistics background specializing in data science, machine learning and trading strategy development. I have been featured on Chatwithtraders.com, Bettersystemtrader.com, Desiretotrade.com, Quantocracy, Traderlife.com, Seeitmarket.com, Benzinga, TradeStation, NinjaTrader and more. Most of my experience has led me to a series of repeatable processes to find, create, test and implement algorithmic trading ideas in a robust manner. Build Alpha is the culmination of this process from start to finish. Please reach out to me directly at any time.

What is Mean Variance Optimization?

Here is the definition from Investopedia.com“Mean–Variance analysis is the process of weighting risk (variance) against expected return. By looking at the expected return and variance of an asset, investors attempt to make more efficient investment choices – seeking the lowest variance for a given expected return or seeking the highest return for a given variance level.”
It also assumes investors are rational and would choose the asset that had lower variance if the expected return of two assets were equal. I will assume you all are!
In layman terms, there are many techniques of portfolio construction, but this test shows two things
  1. Does adding a strategy increase the overall risk:reward of your portfolio or not?
  2. What are the appropriate weights each strategy in my portfolio should be assigned?
This is certainly a crude explanation of mean-variance optimization, but this isn’t an academic blog.

Testing Mean Variance Optimization

This test can be done with either historical or “predicted” returns. We will assign random weights to each of the strategies in the portfolio; the sum of all the weights shall equal 1 (or 100% of allocated capital). After assigning weights to each of the strategies we can generate a risk-adjusted return value or Sharpe Ratio. This is the Sharpe Ratio had we traded each of these strategies with the weight we just assigned to each.
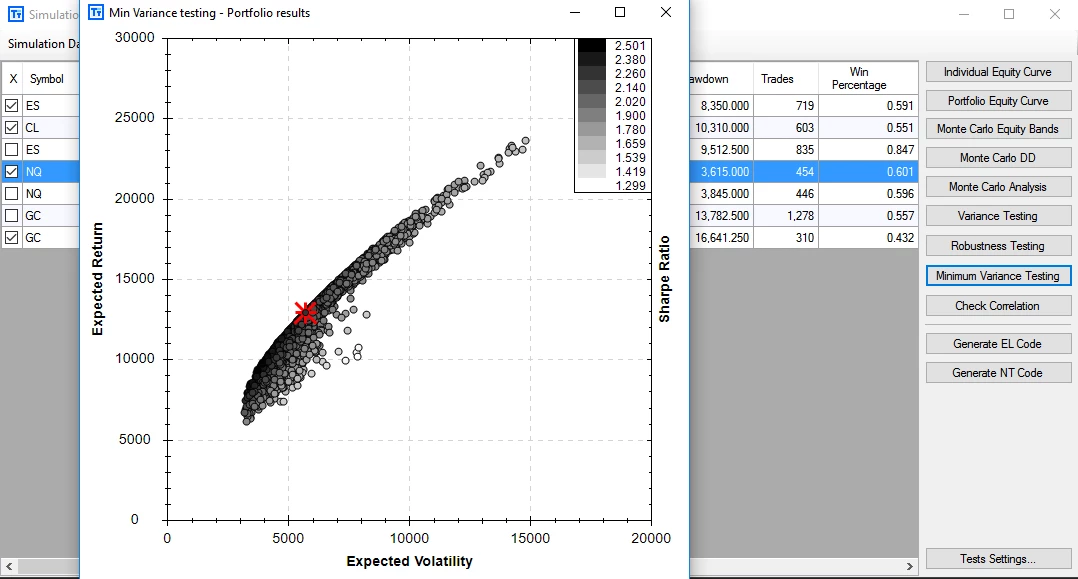
After thousands of tests assigning random weights, we generate a plot of the thousands of Sharpe Ratios. We are trying to find the best weightings to lower the variance in our portfolio while keeping the return as high as possible.  The leftmost dots create the Efficient Frontier and the leftmost dot is considered the minimum variance portfolio. The graph’s legend or color bar shows the highest Sharpe Ratio possible. This portfolio contains the three “checked” strategies on the far left of the photo below and the highest Sharpe from this portfolio is 2.17.
We can then hover over the graph and view the weights that produced a specific Sharpe value or dot on the chart. The idea here is we can see how to weight the strategies in our portfolio to give us the “optimal” or best risk-adjusted reward (optimal portfolio construction) – which is our ultimate goal as trading system developers.
The red dot shows equal weights or how our portfolio would have performed had we traded each strategy with the same position size.

Does this strategy improve my portfolio?

Now to answer the question “does adding this strategy to my portfolio help or hurt expected performance”?  In Build Alpha’s portfolio mode, you can simply include or remove strategies and quickly see if the Sharpe Ratio increases or decreases with this Mean Variance analysis. Below I have selected one additional strategy (see four checks on the far left of the photo below) and you can see a Sharpe Ratio improvement from our original 2.17 to 2.50.
Adding new individual strategies will almost certainly “smooth” out the portfolio’s equity curve, but does it actually increase risk: reward? This test gives a simple, quick way to quantify the addition (or subtraction) of a strategy.

Next Test

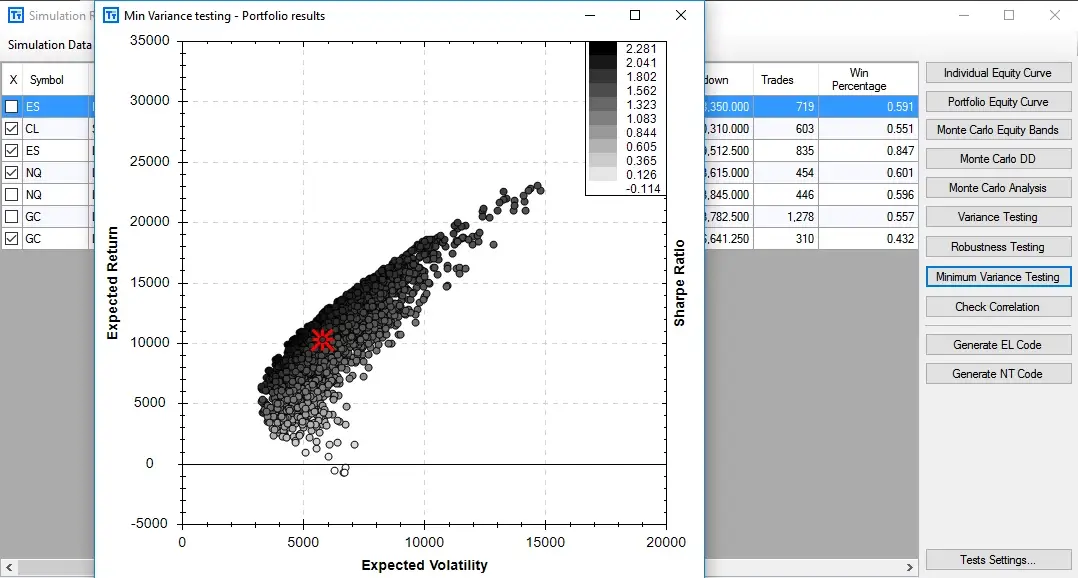
Here I have changed the ES (S&P500 strategy) in the portfolio. I unselected the top ES strategy and selected the other ES strategy. You can see the Sharpe Ratio worsening as it appears this portfolio only achieved 2.28 (vs. previous portfolio configuration of 2.50). This is a good strategy but just does not work as well with the other strategies in the portfolio as the original ES strategy we had included.

Mean Variance Optimization Summary

We want our money to be as efficient as possible and this test or techniques of portfolio construction gives us another check if it is or not.  No point in trading a strategy that is not expected to increase our overall risk reward.
It is now much simpler to compare strategies or to decide whether or not to include a strategy into a portfolio or not. Much of trading comes down to making informed decisions that maximize risk:reward and running this type of analysis certainly increases the information at your disposal. It is now only one click away in portfolio mode.
-Dave
PS: Build Alpha allows traders to import systems built outside Build Alpha for analysis and portfolio construction. Now you can do all of this analysis on Build Alpha strategies, your own strategies, or any combination between.

Author

David Bergstrom – the guy behind Build Alpha. I have spent a decade-plus in the professional trading world working as a market maker and quantitative strategy developer at a high frequency trading firm with a Chicago Mercantile Exchange (CME) seat, consulting for Hedge Funds, Commodity Trading Advisors (CTAs), Family Offices and Registered Investment Advisors (RIAs). I am a self-taught programmer utilizing C++, C# and python with a statistics background specializing in data science, machine learning and trading strategy development. I have been featured on Chatwithtraders.com, Bettersystemtrader.com, Desiretotrade.com, Quantocracy, Traderlife.com, Seeitmarket.com, Benzinga, TradeStation, NinjaTrader and more. Most of my experience has led me to a series of repeatable processes to find, create, test and implement algorithmic trading ideas in a robust manner. Build Alpha is the culmination of this process from start to finish. Please reach out to me directly at any time.
There has been a recent popularity regarding time windows and it is one I completely agree with! There are certain structural changes that happen throughout the 24-hour session and as a trader it is important to take note of these when designing a system or strategy (or just placing trades). For example, how is my strategy’s performance when Asia closes? How about when the US opens?
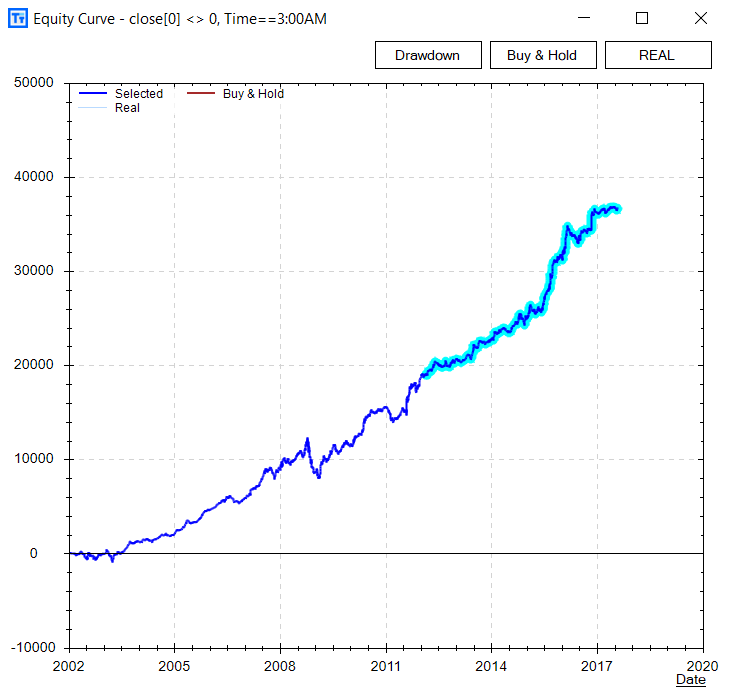
There are also some blatant market anomalies that still exist regarding time windows. The most obvious one, and often popularized by Eric Hunsader of Nanex (and others), is the S&P500 futures performance from 2am to 3am. This little one-hour window looks like quite the edge – and has been persistent despite being publicly known for quite some time.

Using Time Windows to Trade

There are plenty of ways to use the time of the day to your advantage. For instance, only find trades/patterns that exist during a window of time where you might be at your desk. Another simple approach is to filter out unfavorable periods of the day to improve your performance (obviously proper testing methods important here).
My main point is… if you start paying attention to time windows you may be surprised as to what simple edges you’ll discover. It has certainly been a staple in my research for quite a while and I know many other successful traders who put a lot of emphasis on this.

Build Alpha Upgrades

I’ve recently upgraded Build Alpha to allow for intraday strategy creation and time window filtering (among other things). Inside BA you can now select (and create your own) time windows to use as input in the strategy creation engine. There is also a time of day test which allows you to select certain windows to see if it improves strategy performance.
Here are a few examples

Free Friday 20 Example Strategy

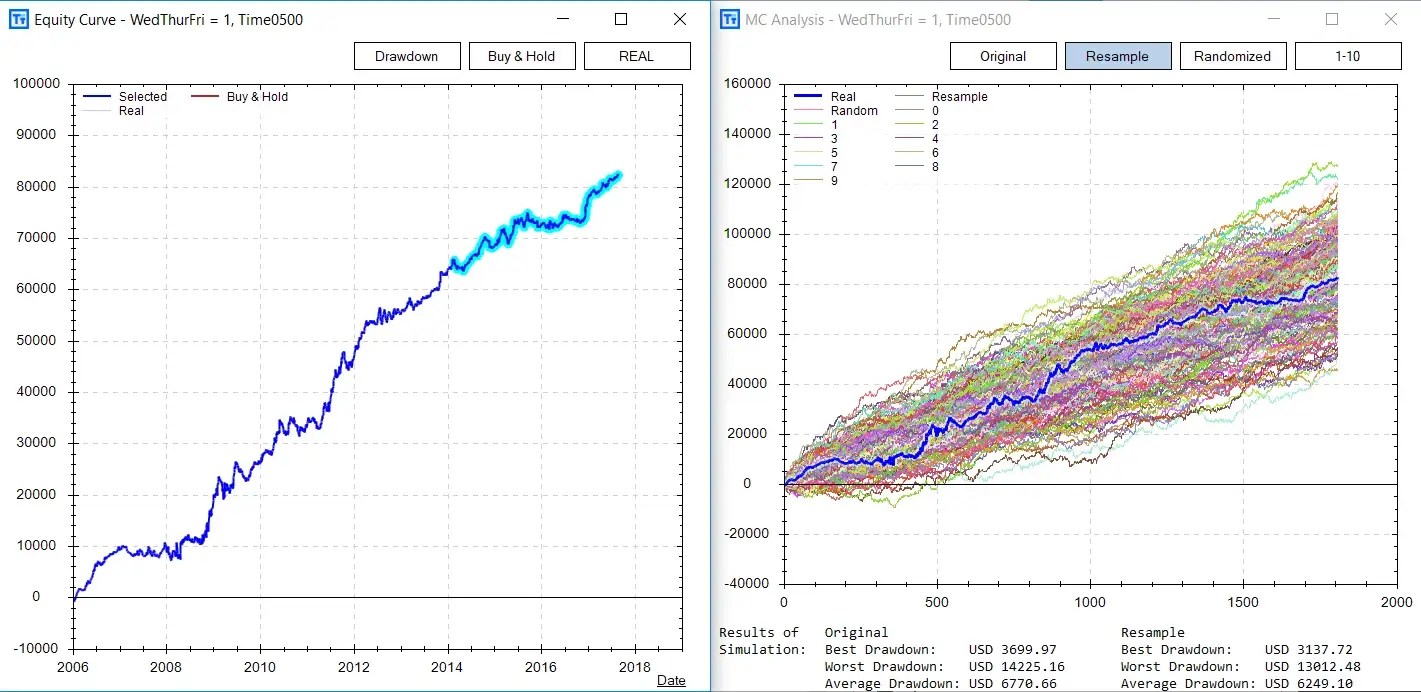
Below is a simple strategy that shorts EURUSD (I used the futures contract) at 5:00 am EST every Wednesday, Thursday, and Friday morning. This idea simply holds the short trade for 3 hours.
These two might not be standalone strategies, but can certainly give you a head start for continued research, act as a filter for other strategies or be paired with other ideas to create fully operational strategies.
Trading is extremely competitive. Looking at price alone may be too naïve in today’s market; there is simply too much computing power looking at it. If you’re struggling to find quantified edges then maybe it is time (pun intended) to start pairing price action with time filters.
As always, thanks for reading. And please stay safe with all these hurricanes!
Thanks for reading,

Author

David Bergstrom – the guy behind Build Alpha. I have spent a decade-plus in the professional trading world working as a market maker and quantitative strategy developer at a high frequency trading firm with a Chicago Mercantile Exchange (CME) seat, consulting for Hedge Funds, Commodity Trading Advisors (CTAs), Family Offices and Registered Investment Advisors (RIAs). I am a self-taught programmer utilizing C++, C# and python with a statistics background specializing in data science, machine learning and trading strategy development. I have been featured on Chatwithtraders.com, Bettersystemtrader.com, Desiretotrade.com, Quantocracy, Traderlife.com, Seeitmarket.com, Benzinga, TradeStation, NinjaTrader and more. Most of my experience has led me to a series of repeatable processes to find, create, test and implement algorithmic trading ideas in a robust manner. Build Alpha is the culmination of this process from start to finish. Please reach out to me directly at any time.
What is an intraday check? It is a phrase I am trying to coin, but I will explain the concept here..
There are certain rules (mainly for intraday strategies) that I believe should be applied to each strategy to check if there are any “hidden edges” in the underlying strategy.

Intraday Trading Checks

So what are these rules? And how can we test them? Well, Build Alpha now offers a test that allows users to test any intraday trading strategy to find out if it is as efficient as it can be or if there are any “hidden edges” within the strategy as I like to call it. Here are the additional intraday rules or checks.
  1. Time windows. Is the strategy improved by only trading between certain times of the day?
  2. Max Trades per day. A maximum number of trades per day count. Is the strategy improved by limiting the number of trades per day?
  3. Minimum P&L per day. Is the strategy improved by limiting the amount of money it is allowed to lose per day? For example, automatically turn the strategy off for the day once you’ve lost $500 today.
  4. Maximum P&L per day. Is the strategy improved by stopping the trading when an amount of money is earned per day? For example, automatically stop trading for the day once you’ve made $2,500 today.
Obviously, these tests are common and obvious ideas to look for hidden edges and strategy improvements – and of course, with all things, we need to use proper data analysis techniques (in vs out of sample, sample size, etc.) which I am not going to get into in this post as I have other posts regarding that.

Test Setup in Build Alpha

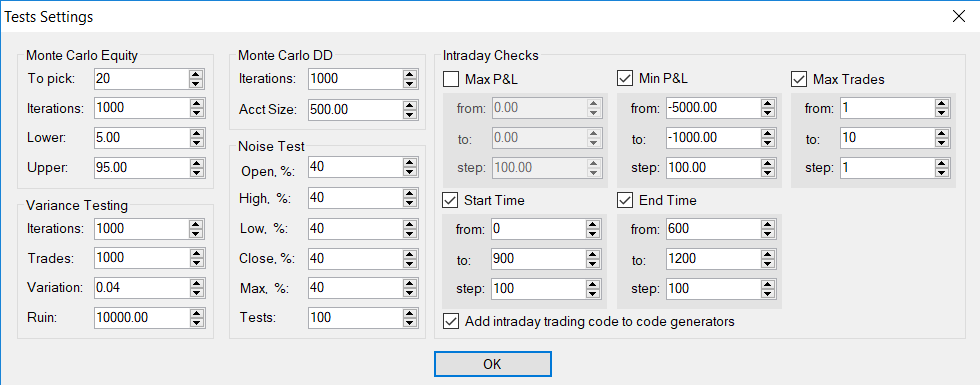
The Intraday Checks test can be easily configured by clicking on the “Test Settings” button and configuring the right-hand side of the pop-up window seen below:
The coolest feature of this addition to the software is the ability to add any of the newly found rules to the generated code for any of the supported Build Alpha platforms. For example, if you find a rule (or few rules) that improves the original strategy then you can double-click the test result and BuildAlpha will automatically incorporate those rules when generating trading code for TradeStation, MultiCharts, Ninjatrader or MetaTrader.

Build Alpha Intraday Checks Example

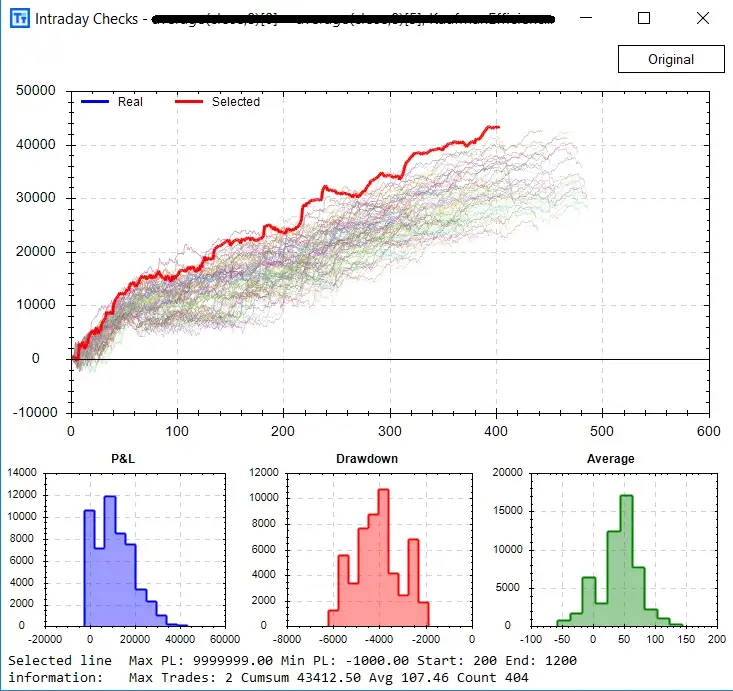
Here is a photo after selecting (double-clicking) on a test result which would then add this test’s rules to the exportable code. The highlighted red (selected) strategy’s rules can be seen at the bottom of the graph.
This selected strategy would add the rules
  • Max Trades per day: 2
  • Only take entries between 2:00 am and 12:00pm
  • Stop trading each day after losses reach $1,000 per day
Finally, the histograms below the graph show the distribution of all the tests on the intraday rules. This is important to make sure you’re not just selecting an outlier but that the underlying distribution/simulation itself was strong. Again, this post is not meant to get into selection bias and other potential pitfalls as I have other content about that.
All in all, it is important to search every nook and cranny to make sure we’re not leaving money on the table or missing an easy edge or strategy filter. This test aims to help in that regard.
For those interested in more Intraday Trading tools take a look at the Intraday Edge test.
Thanks for reading,

Author

David Bergstrom – the guy behind Build Alpha. I have spent a decade-plus in the professional trading world working as a market maker and quantitative strategy developer at a high frequency trading firm with a Chicago Mercantile Exchange (CME) seat, consulting for Hedge Funds, Commodity Trading Advisors (CTAs), Family Offices and Registered Investment Advisors (RIAs). I am a self-taught programmer utilizing C++, C# and python with a statistics background specializing in data science, machine learning and trading strategy development. I have been featured on Chatwithtraders.com, Bettersystemtrader.com, Desiretotrade.com, Quantocracy, Traderlife.com, Seeitmarket.com, Benzinga, TradeStation, NinjaTrader and more. Most of my experience has led me to a series of repeatable processes to find, create, test and implement algorithmic trading ideas in a robust manner. Build Alpha is the culmination of this process from start to finish. Please reach out to me directly at any time.
A crazy cool way to use Build Alpha. I have to admit that I did not come up with this idea, but it was suggested to me by a Build Alpha user.
He was wondering if Build Alpha could help come up with some rules of when he should avoid trading his existing strategy or even when to fade his existing strategy. Heck any improvement is a plus, right?
**Please note Build Alpha now accepts data in this format:  mm/dd/yyyy, hh:mm, open, high, low, close, volume, OI. Please refer to buildalpha.com/demo page for adding own data instructions**
*I say we found one strategy but we actually found tons that would be an improvement to his original strategy. Him and I only spoke specifically about one so that’s why in the video I slip and say we found one strategy. Did not feel like making a new video to clarify this minor point.*

Example Walkthrough

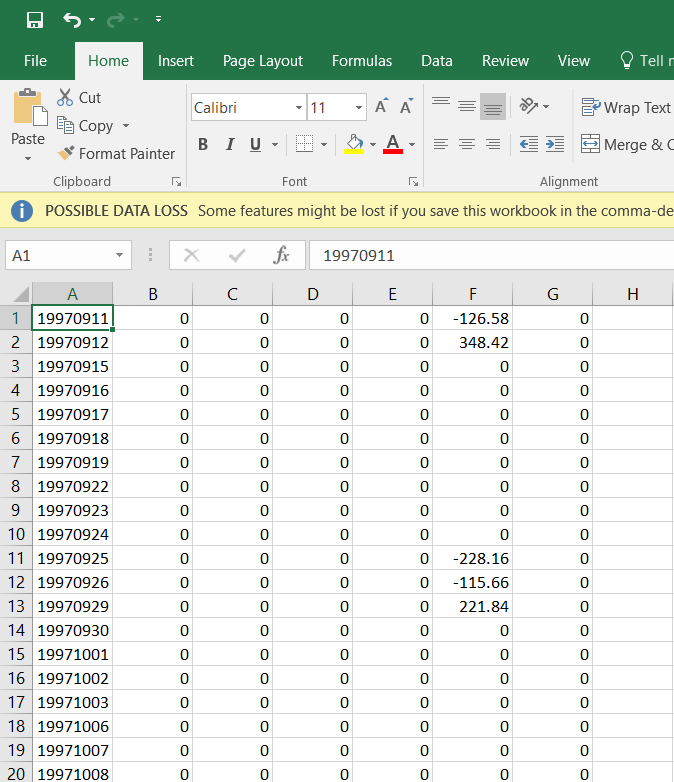
He had a day trading system and compiled profit and loss results for that system in the following (Build Alpha accepted) format. Date, time, open, high, low, close, volume.  (*note BuildAlpha now accepts the time column as intraday capabilities are becoming fully operational*).
Below is his sample file. We purposely left the open (high and low) columns as all 0’s. The close column contains the end of day p&l from his original strategy.
We then set Build Alpha to have a maximum one bar holding period and to ONLY enter on the next bar’s open and to the ONLY exit on the next bar’s close. I will explain why this is in a minute.
We then chose the underlying symbol the original strategy was built on as market2 in the upper left of the main screen. For example, his original strategy trades ES (S&P500 Emini futures) so we only select Build Alpha signals calculated on Market2 which is set for ES.
So now if Build Alpha calculates a rule on ES-like close[0] <= square root(high[0] * low[0]) then we would “buy” the next bar’s open of market1 (again his results – which are 0) and “sell” the next bar’s close of his results which is the original strategy’s p&l for that day. This would essentially say that if this rule is true then go ahead with a green light to trade the original strategy the next day. If the rules are not true, then don’t trade the original strategy the next day. Ideally, we can find rules that increase risk-adjusted returns for the original strategy (which we did).

Fade the original trading strategy?

Now, what is even cooler is if we set Build Alpha to find short strategies we would essentially be “fading” his original strategy or finding rules of when to go opposite his original strategy.
Build Alpha found some good short/ “fade” rules to use as well. Here is an example that did quite well selectively fading his original strategy (even out of sample – highlighted section).
After emailing him the results here is what he had to say in his email response:
“There are 2028 negative periods in my data with a gross loss of -1,217,880.26. That’s the theoretical maximum a short rule can achieve, if it were to find all losses. Your graph seems to show 380,000 short rule profits. That’s already 31% of all losses. If I don’t trade on these days, my net profit would go up by 380,000, a 46% increase.
I thought this was a really unique way to use Build Alpha and I wanted to share. I think the same analysis can be done on strategies with longer holding periods, too. I would just import daily marked to market results of the original strategy and Build Alpha can find rules of when to hedge your strategy or fade it for a day or two. I think this is certainly a unique approach to add some alpha to performance.
Anyways, thanks for reading as always and keep a lookout for some MAJOR upgrades coming to Build Alpha very soon!
Thanks for reading,

Author

David Bergstrom – the guy behind Build Alpha. I have spent a decade-plus in the professional trading world working as a market maker and quantitative strategy developer at a high frequency trading firm with a Chicago Mercantile Exchange (CME) seat, consulting for Hedge Funds, Commodity Trading Advisors (CTAs), Family Offices and Registered Investment Advisors (RIAs). I am a self-taught programmer utilizing C++, C# and python with a statistics background specializing in data science, machine learning and trading strategy development. I have been featured on Chatwithtraders.com, Bettersystemtrader.com, Desiretotrade.com, Quantocracy, Traderlife.com, Seeitmarket.com, Benzinga, TradeStation, NinjaTrader and more. Most of my experience has led me to a series of repeatable processes to find, create, test and implement algorithmic trading ideas in a robust manner. Build Alpha is the culmination of this process from start to finish. Please reach out to me directly at any time.

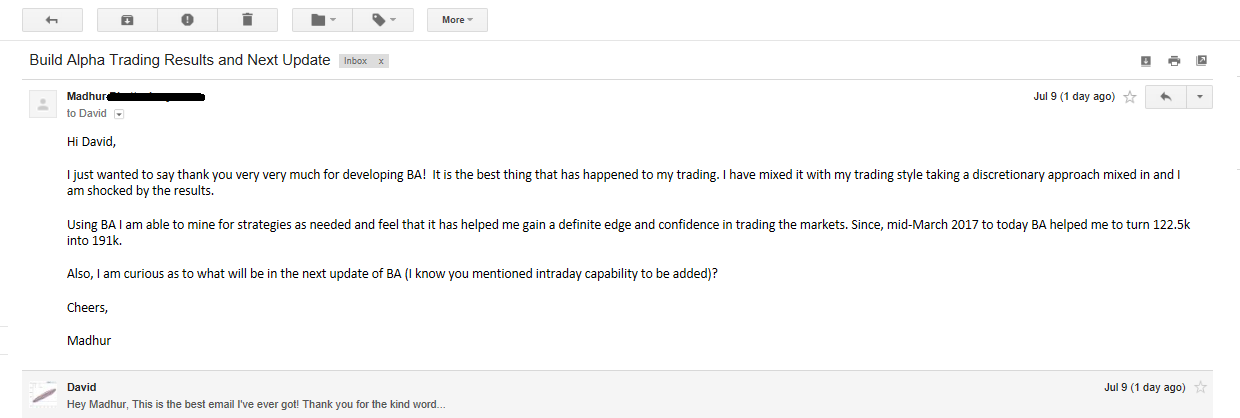
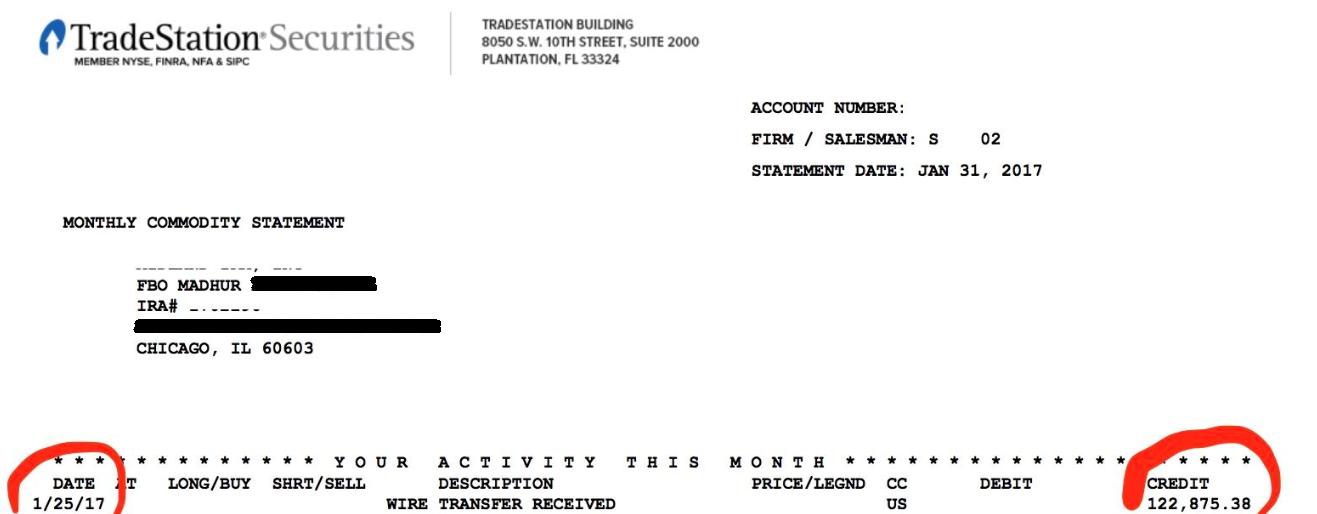
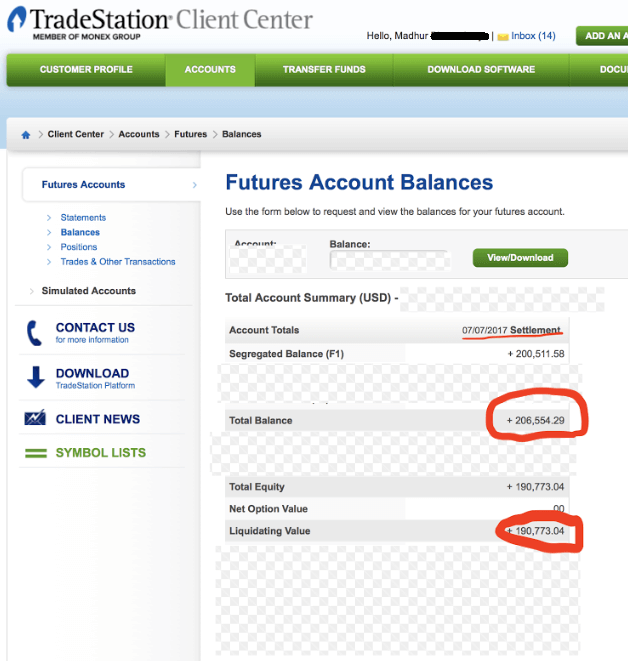
This is hands down the best email I have received since launching the BuildAlpha software a little over six months ago. It is a thank you note sent from a Build Alpha user, Madhur, who licensed the software back in March 2017 and has grown his account about $70,000 in that span (or about +55.92%).

Below is a photo of the email he sent and his account statements verifying his amazing first three months of trading while using the software.
What is amazing is that Madhur is/was a discretionary or hand trader! That’s right, he’s found a way to combine what he was already doing and the systematic edges that the Build Alpha software can find to further increase his OVERALL edge in the markets.
I love this story for so many reasons. First, it shows that finding a trading edge is vital regardless if you choose to automate your execution or not. Second, Build Alpha is a trading tool and not necessarily a system trading tool (albeit geared toward system traders no doubt). Third, Madhur found a unique way to incorporate the old with the new to make something better – a lesson for all traders (myself included).
I have received tons of emails of Build Alpha success and thank you notes, but none as specific as this one. It is hard to market user success without the proof otherwise you all would have your doubts (rightfully so) – but after receiving this I cannot help but feel proud and share.

Congrats Madhur and the other successful Build Alpha users out there! Thanks for pushing my development of the software and continuing to support me with this pursuit.

Also, please read all the disclaimers. I am not guaranteeing that if you license the software and poof 3 months later you are up big. No one can promise anything in this game – I just wanted to share a story that put a smile on my face and makes all the development hours worth it!
Thanks for reading,

Author

David Bergstrom – the guy behind Build Alpha. I have spent a decade-plus in the professional trading world working as a market maker and quantitative strategy developer at a high frequency trading firm with a Chicago Mercantile Exchange (CME) seat, consulting for Hedge Funds, Commodity Trading Advisors (CTAs), Family Offices and Registered Investment Advisors (RIAs). I am a self-taught programmer utilizing C++, C# and python with a statistics background specializing in data science, machine learning and trading strategy development. I have been featured on Chatwithtraders.com, Bettersystemtrader.com, Desiretotrade.com, Quantocracy, Traderlife.com, Seeitmarket.com, Benzinga, TradeStation, NinjaTrader and more. Most of my experience has led me to a series of repeatable processes to find, create, test and implement algorithmic trading ideas in a robust manner. Build Alpha is the culmination of this process from start to finish. Please reach out to me directly at any time.
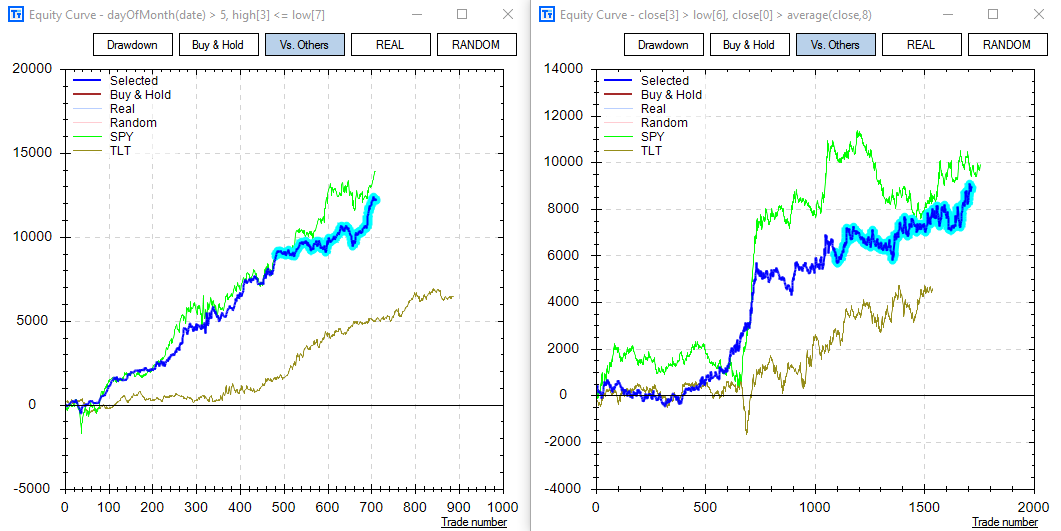
This Free Friday, Free Friday #19, is a user submission! It is a long/short strategy for $IWM – the Russell 2000 ETF. Both the long and the short strategy only have two rules each and only hold for 1 day. Below I’ve posted the long strategy on the left and the short strategy on the right. Short edges have certainly been difficult to find over the past few years in the US equity indexes on a daily time frame, but one hopes they’ll pay for the effort when/if things turn south!
Both strategies were tested from 2002 to 2017 using 35% out of sample data. All performance is based on only a simple 100 shares per trade. *1 S&P500 futures contract is equivalent to about 500 $SPY shares for reference*
There is also $SPY (green plot) and $TLT (gold plot) plotted to see how the strategies would have performed on these markets as well; the strategy maintains profitability in both cases.
The long strategy rules are simple and all trades exit at the next day’s open.
  1. Day number is greater than 5. Today is June 30, 2017. Today’s day number is 30.
  2. High[3] <= Low[7]
The short strategy rules are simple as well and all trades exit at the next day’s open.
  1. Close[3] > Low[6]
  2. Close[0] > 8 Period Simple Moving Average
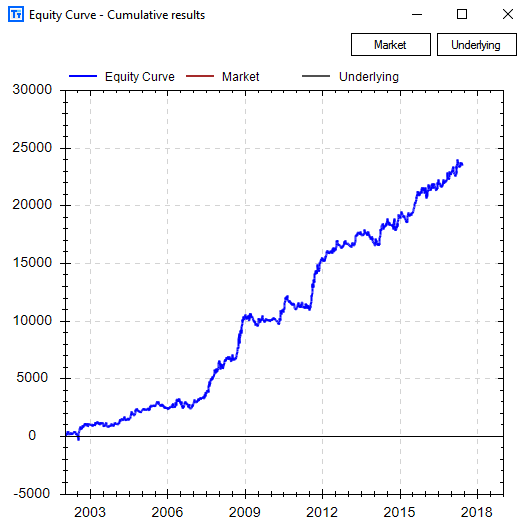
Below there is a photo of the long/short equity performance for this simple portfolio.
I also want to add an update to some of the Free Friday strategies. Things were pretty quiet for most of the futures strategies other than the equity index strategies this month.
Strategies #5, #6, #16 were the only futures strategies that traded so I wanted to show their June performance below.
Nasdaq #5: +$1,640.00
Russell Futures #6: +680.00
S&P500 Futures #16: +862.50
Again, all are just trading 1 contract for demonstration purposes and were posted publicly months ago. You can see the strategies on twitter here: @dburgh
Thanks as always and have a Happy Fourth of July,

Author

David Bergstrom – the guy behind Build Alpha. I have spent a decade-plus in the professional trading world working as a market maker and quantitative strategy developer at a high frequency trading firm with a Chicago Mercantile Exchange (CME) seat, consulting for Hedge Funds, Commodity Trading Advisors (CTAs), Family Offices and Registered Investment Advisors (RIAs). I am a self-taught programmer utilizing C++, C# and python with a statistics background specializing in data science, machine learning and trading strategy development. I have been featured on Chatwithtraders.com, Bettersystemtrader.com, Desiretotrade.com, Quantocracy, Traderlife.com, Seeitmarket.com, Benzinga, TradeStation, NinjaTrader and more. Most of my experience has led me to a series of repeatable processes to find, create, test and implement algorithmic trading ideas in a robust manner. Build Alpha is the culmination of this process from start to finish. Please reach out to me directly at any time.

What is Open Interest?

Open Interest is just the total number of outstanding contracts that are held by market participants at the end of each day. All derivatives have Open Interest. That is, both futures and options have their own Open Interest.
For example, the March SP500 e-mini futures contract can have its own Open Interest while the March 4000 Strike Call option can also have an its own Open Interest.
Open Interest is a proxy for cash flowing into the market. If Open Interest increases, then more money is moving into the market whereas Open Interest declining could be seen as cash leaving the market.

How is Open Interest Calculated?

Open Interest is calculated by adding all the contracts from opened trades and subtracting the contracts when a trade is closed.
For example, Steve, Chris, and Clay are trading the same futures contract. If Steve buys two contracts to open a long trade, open interest increases by two. Chris also longs four contracts, thus increasing open interest to six. If Clay puts on a short trade of three contracts, open interest again increases to a new total of nine.
Open Interest would remain at nine until any traders exit positions, which would cause a decline in open interest. If Steve sells both of his contracts and Chris exits two of his four contracts, then open interest would decrease by four from nine to five.

What is the difference between Open Interest and Volume?

Both are similar as they count total contracts traded. However, volume is a count of all traded contracts and open interest is a total of the contracts that remain open.
If a trader buys one contract, then both volume and open interest are one. If the trader sells the contract, then volume is two and open interest is zero. Volume is a running total of all transactions and Open Interest is the total of all open positions.

Is higher or lower Open Interest better?

Better is relative to your current market view or position. However, typically higher open interest is good because it signals more interest in a particular contract or strike price and may also signify that there is more available liquidity (i.e., exiting shall be easier and you may experience less slippage).
On the other hand, lower open interest may be a positive too. If the market moves or news comes out in favor of your existing position, then many traders may need to pile into your same trade pushing price in your direction.
When in doubt, test your ideas on whether higher or lower Open Interest is better. That is what Build Alpha is for! Stay tuned for an example strategy later.

What is an Open Interest strategy?

A trading strategy that relies on Open Interest as an input signal or filter can be considered an Open Interest trading strategy. For example, if Open Interest rises by x% then buy or if Open Interest is greater than the N-day average, etc.
There are a ton of creative ways to incorporate Open Interest data into your algo trading strategy development process. Creativity is often a source of alpha!

Open Interest Trading Strategy Example

As always, happy Friday!
This week I was asked by a Build Alpha user if he could build strategies using a contract’s Open Interest. Open Interest is just the total number of outstanding contracts that are held by market participants at the end of each day. So, it is intuitive that as more contracts are opened or closed then it might be telling of how traders are positioning.
This is a detailed and advanced post. Build Alpha is all point and click, but this is certainly a way more advanced blog post showing how a more sophisticated user can utilize the software.
I have to admit this is not something I have looked at previously so I was quite intrigued, but I pulled some open interest data from TradeStation and saved it.

Structing Open Interest Data

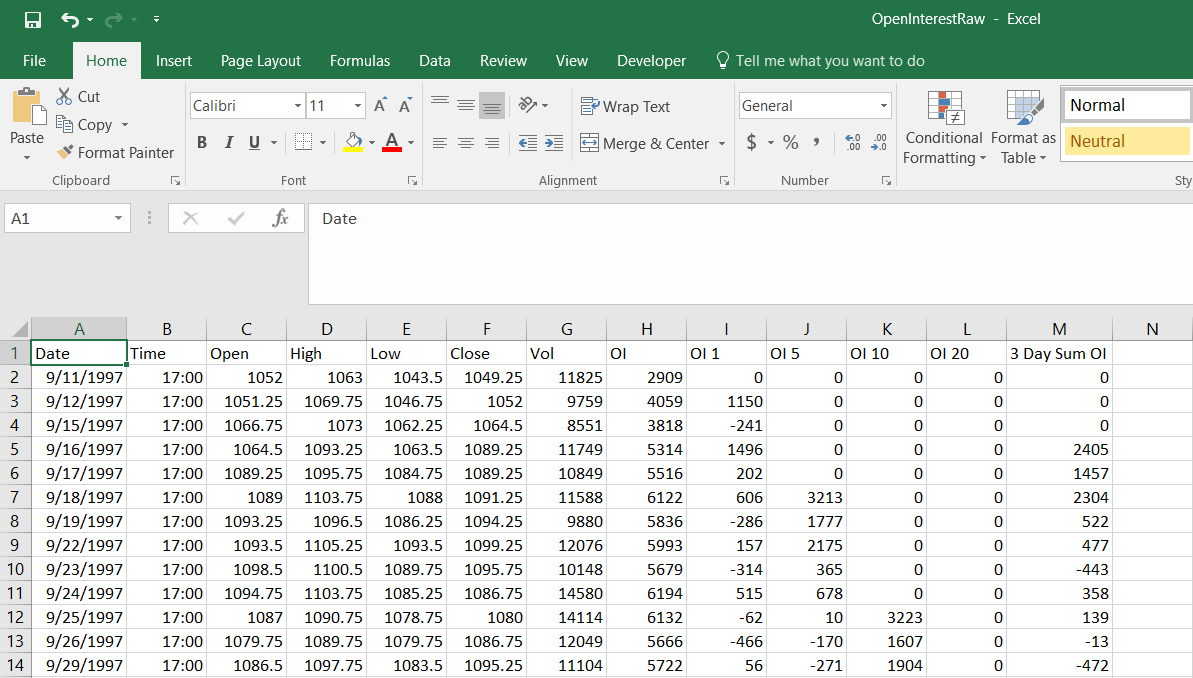
I then went on to create columns I – M below. Columns I-L are momentum measures (N period change) of Open Interest. For example, column J holds the Open Interest change over the past 5 days. Column K holds the Open Interest change over the past 10 days. Column N just holds the 3-bar sum of the 1-period momentum of Open Interest. The data can be seen below opened in Excel (I know who uses Excel anymore).
Build Alpha Custom Open Interest Data Import in Excel
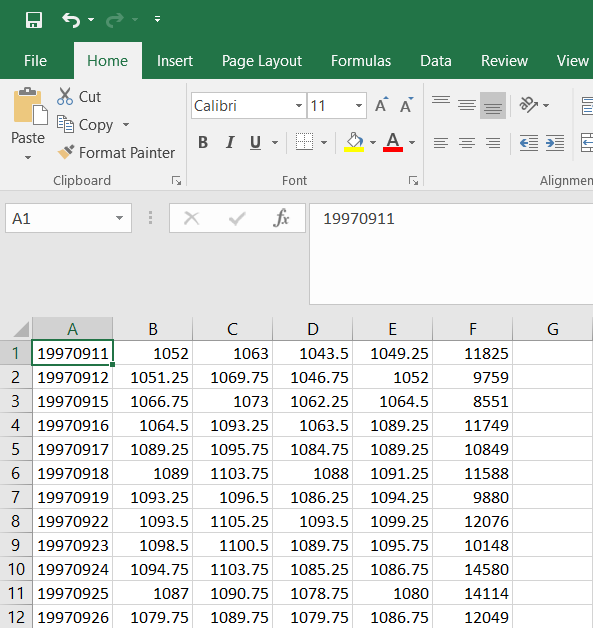
In order to use the above data in BuildAlpha, we need to format two separate files. First, we need to create a date, open, high, low, close, volume file of the actual S&P500 futures data (columns A, C, D, E, F, G). I copy and pasted those columns to a new sheet and then reformatted the date to YYYY/MM/DD, removed the headers, and saved it as a .csv file. Pictured below…
Excel Open Interest Data formatted for Build Alpha import
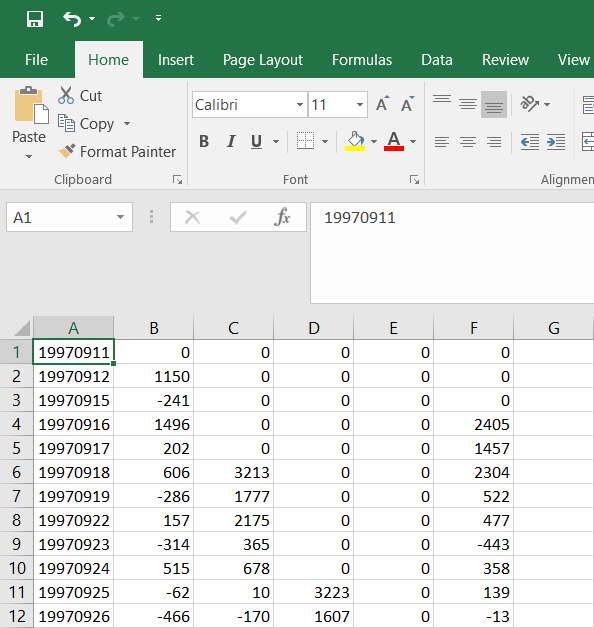
I then copy and pasted our dates and custom Open Interest data to a new excel sheet. This time instead of having the date, open, high, low, close, the volume we’ll use (copy) the date, 1-period OI change, 5-period OI change, 10-period OI change, 20-period OI change, 3 bar sum of OI as our six columns.
Open Interest Data in Excel formatted for Build Alpha
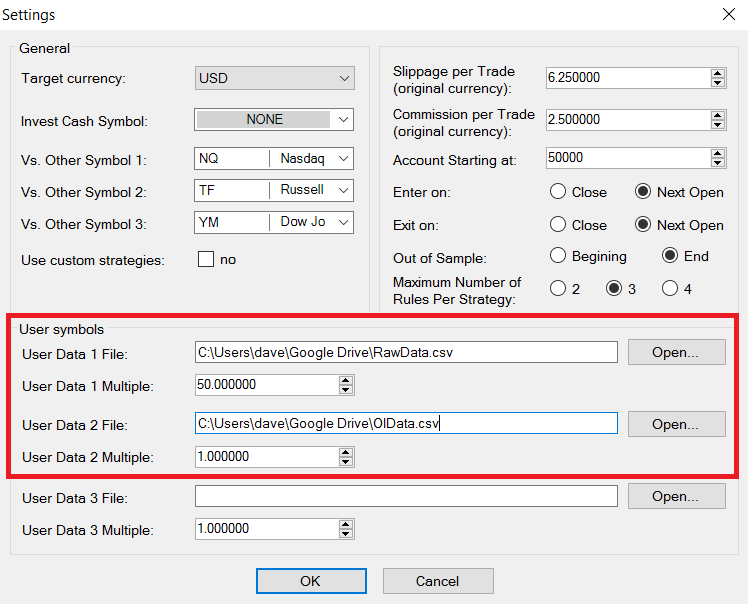
We can now pass this data into Build Alpha and build strategies using the Intermarket capabilities. However, in this case, our intermarket or Market 2 will be this custom open interest data and not some other asset.
Build Alpha Import Custom Data
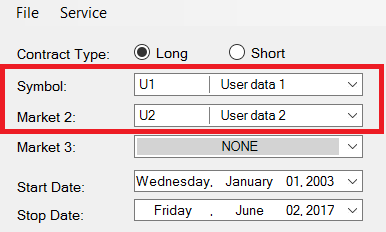
Build Alpha custom symbol selection

Video Examples

The two videos below show exactly how I did this process in case you didn’t follow my Thursday night, two glasses of scotch deep, blog writing.

Build Alpha Open Interest Strategy Example

There is a different strategy displayed in the video above, but I promised some guys on twitter I’d share the strategy I posted Thursday. So below is the actual Free Friday #18. It holds for one day and trades when these conditions are true:
  1. Momentum(OpenInterest,20)[0] <= Momentum(OpenInterest,20)[5]
  2. Momentum(OpenInterest,20)[0] > Momentum(OpenInterest,5)[1]
  3. Momentum(OpenInterest,10)[0] > Momentum(OpenInterest,10)[1]
Open Interest Strategy Equity Curve in Build Alpha
**S&P500 Futures strategy built on open interest data only and tested across Nasdaq, Dow Jones, and Russell Futures. Results just based on 1 contract**
So the last rule in Build Alpha would appear as Low2[0] > Low2[1] or translated as the low of Market 2 is greater than the low of Market 2 one bar ago. However, if you remember we created a custom data series for Market 2 and in the low column, we inserted the 10-period momentum of open interest!
Like I said this is a confusing post, but a really neat idea of how creative you can be with this software. The possibility of things we can test are immense.
Furthermore, when Build Alpha calculates RSI or Hurst, for example, using the close price of Market 2 (our intermarket selected) it will actually calculate RSI or Hurst on 20 bar momentum of the Open Interest (what we passed in for the close column)! You can also use the custom indicator/rule builder on these custom data columns.
You can also run strategies built on custom data like this through all the robustness and validation tests as well.
All in all, thanks for reading. I thought this was a cool idea taking system development to a whole new level.
Cheers,
Old Posts:

Author

David Bergstrom – the guy behind Build Alpha. I have spent a decade-plus in the professional trading world working as a market maker and quantitative strategy developer at a high frequency trading firm with a Chicago Mercantile Exchange (CME) seat, consulting for Hedge Funds, Commodity Trading Advisors (CTAs), Family Offices and Registered Investment Advisors (RIAs). I am a self-taught programmer utilizing C++, C# and python with a statistics background specializing in data science, machine learning and trading strategy development. I have been featured on Chatwithtraders.com, Bettersystemtrader.com, Desiretotrade.com, Quantocracy, Traderlife.com, Seeitmarket.com, Benzinga, TradeStation, NinjaTrader and more. Most of my experience has led me to a series of repeatable processes to find, create, test and implement algorithmic trading ideas in a robust manner. Build Alpha is the culmination of this process from start to finish. Please reach out to me directly at any time.
As always, happy Friday!
In this Free Friday post, I want to pose a poll question. After reading the post and viewing the graphs please respond to the poll below and I will publish the results in another post later next week.
The question is… would you trade this strategy?
First, let’s go over the strategy. The strategy was designed using GBPAUD spot data and only has three rules to determine entry. The simulation to create this strategy (and hundreds of other strategies) took less than 2 minutes.
  1. Vix[0] > Vix[1]  – Remember [1] means 1 bar ago
  2. High[4] <= Close[6]
  3. Low[6] <= High[8]
The strategy has two exit criteria. A 1.5 times 20 Period ATR profit target and 1.0 times 20 period ATR stop loss.
Here are some simple performance measures
  • January 1, 2003 to May 1, 2017 (Last 30% Out of Sample)
  • Profit $147,626.20
  • Drawdown $8,289.70
  • Win Rate 54.50%
  • Trades 198
  • Sharpe 1.78
T-Test 3.76
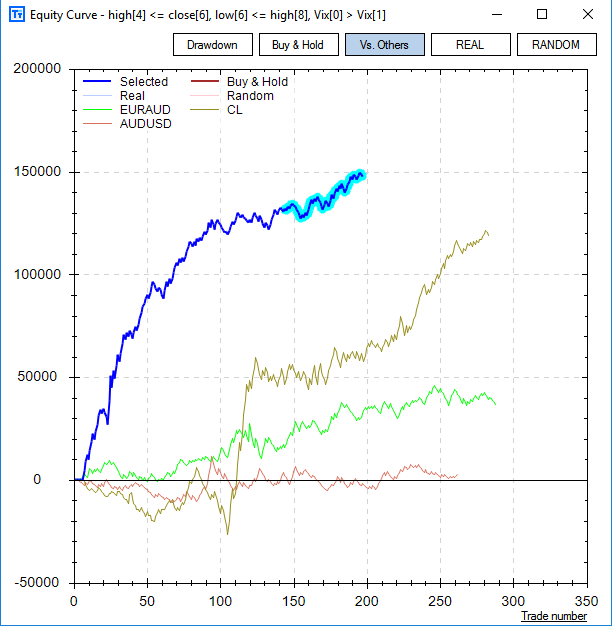
Here is the strategy’s equity curve on GBPAUD. You can see the short strategy continues to perform in the out of sample period (highlighted portion of the blue line).
I’ve also plotted how the strategy performed on three other markets. It remains profitable on Crude Oil futures, Canadian Dollar futures, and AUDUSD spot. Generally, we like to see profitability across markets and assets. However, how good is good enough to pass the test?
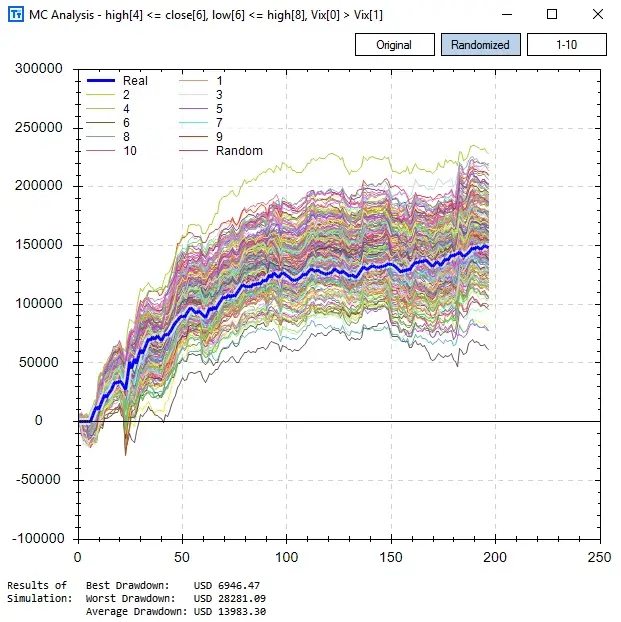
Next, I want to share the randomized Monte Carlo test. This test re-trades the strategy 1000 times but randomizes the exit for each entry signal. It is a test to see if we have curve-fit our exits and if our entry is strong enough to remain profitable with random exits. We can see the randomized Monte Carlo test maintains general profitability. Some fare better and some worse.
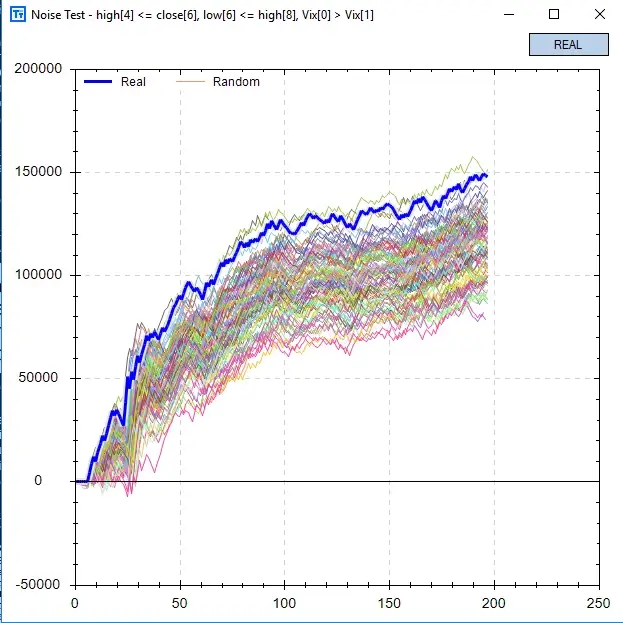
Next I want to share the Noise Test. This test adds and subtracts random amounts of noise (percentage of ATR) to user-selected amounts of data creating 100 new price series with differing amounts of noise. The test then re-trades the strategy on these 100 new price series to see if profitability is maintained on price series with differing amounts of noise. You can see here that as we change the noise the performance degraded a bit and there are some signs of curve-fitting to the noise of the original price series.
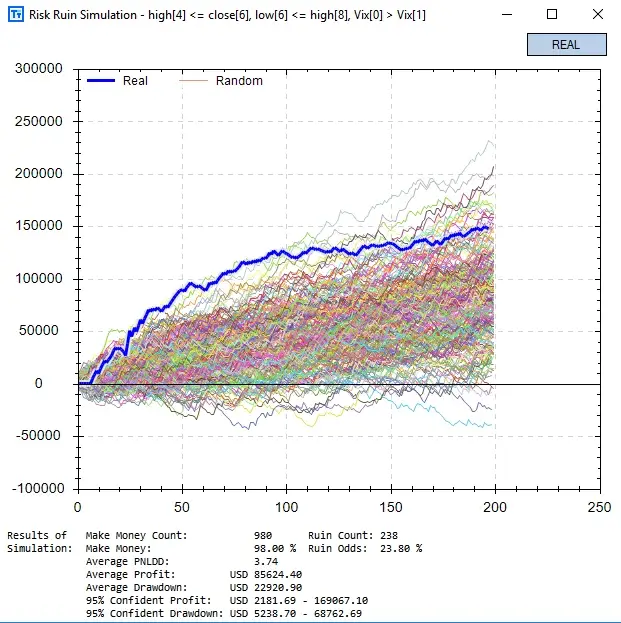
Next, I want to share the forward simulator or variance testing results. In this test, we simulate the strategy forward but assume the winning percentage will degrade by 5% (user defined % in test settings). This is a useful test because things are never as rosey as our backtest results. Now we can get an idea of how things can play out in the future if the strategy were to win x% less than it did in our backtest. This is good for setting expectations of where we expect to be in the next N trades as well.
Risk of Ruin was set to $10,000 for this test. So interpreting these results… if the winning percentage in the future is 5% lower than our backtest than 23% of our simulations will have a drawdown of 10,000 or more.
This is all the information I want to provide for this poll. There are plenty more tests and information we can gather (like E-Ratio), but I want to avoid analysis by paralysis. Build Alpha licenses come with access to a 20+ video library where I explain what I look for in all the tests and features offered by Build Alpha.
If you answered yes to this poll and have a BA license then you can now generate trade-able code for MetaTrader4 in addition to the original TradeStation, MultiCharts, and NinjaTrader.
A trading strategy that relies on Open Interest as an input signal or filter can be considered an Open Interest trading strategy. For example, if Open Interest rises by x% then buy or if Open Interest is greater than the N-day average, etc.
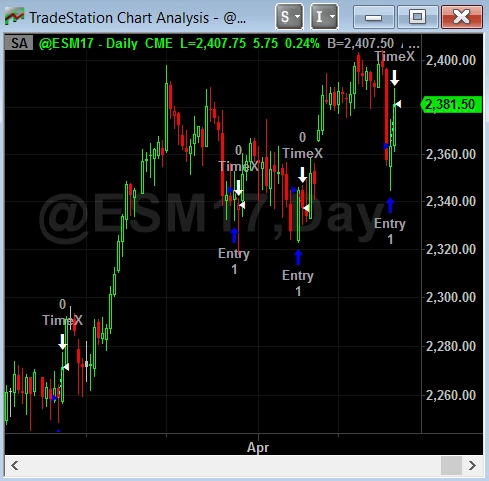
I also hope all you ES (S&P500) traders that email me caught the dip last Friday like the first Free Friday strategy did (pictured below). I posted this strategy on Twitter in 2016 and it only holds for 1 day. I know a few of you have adjusted the logic and I’m hoping you caught the whole move to new highs!
Happy Friday,
Old Posts:

Author

David Bergstrom – the guy behind Build Alpha. I have spent a decade-plus in the professional trading world working as a market maker and quantitative strategy developer at a high frequency trading firm with a Chicago Mercantile Exchange (CME) seat, consulting for Hedge Funds, Commodity Trading Advisors (CTAs), Family Offices and Registered Investment Advisors (RIAs). I am a self-taught programmer utilizing C++, C# and python with a statistics background specializing in data science, machine learning and trading strategy development. I have been featured on Chatwithtraders.com, Bettersystemtrader.com, Desiretotrade.com, Quantocracy, Traderlife.com, Seeitmarket.com, Benzinga, TradeStation, NinjaTrader and more. Most of my experience has led me to a series of repeatable processes to find, create, test and implement algorithmic trading ideas in a robust manner. Build Alpha is the culmination of this process from start to finish. Please reach out to me directly at any time.
The role of luck in (algorithmic) trading is ever present. Trading is undoubtedly a field that experiences vast amounts of randomness compared to mathematical proofs or chess, for example.
That being said, a smart trader must be conscious of the possibility of outcomes and not just a single outcome. I spoke about this in my Chatwithtraders.com/103 interview, but I want to reiterate the point as I am often asked about it to this day.
The point I want to make is that it is very important to understand the distribution your trading strategy comes from and not just make decisions off the single backtest’s results. Doing so can increase a trader’s “luck”.
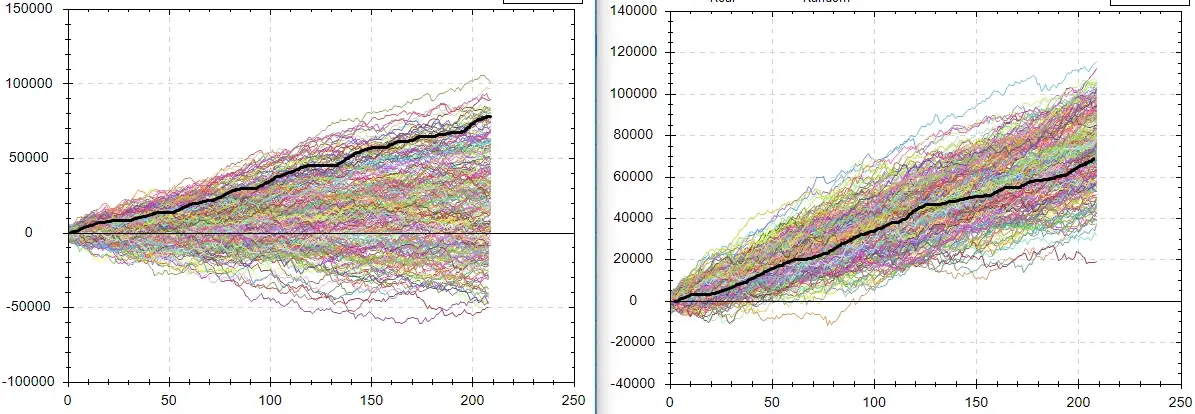
In the interview I spoke about this graph below that shows two different trading systems that have very similar backtests. The black line on the left represents system A’s backtest and the black line on the right represents system B’s backtest. For our intents and purposes let’s assume the two individual backtest results are “similar” enough producing the same P&L over the same number of trades.
The colorful lines on the left is system A simulated out (can use a variety of methods such as Monte Carlo, Bootstrapping, etc.) and the colorful lines on the right is system B simulated out using the same method. These are the possible outcomes or paths that system A and system B can take when applied to new data (Theoretically – read disclaimers about trading).
These graphs are the “distributions of outcomes” so many successful traders speak about. This picture makes it quite obvious which system you would want to trade even though system A and system B have very comparable backtests (black lines).
*There are many ways to create these “test” distributions but I will not get into specifics as BuildAlpha does quite a few of them*

Another View

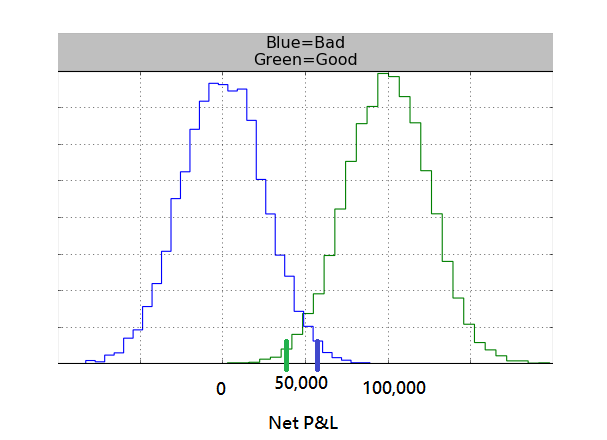
This second example below demonstrates this point in another way but incorporates the role luck can have on your trading. Let’s say the blue line is the single backtest from System A (blue distribution is all possibilities). The single green line is the single backtest from System B (green possibilities).
In this graph, you can see that System A (part of the blue possibilities) was lucky and performed way better than most of the possibilities and of course better than the single backtest for System B.
You can also see that System B (part of the green possibilities) was extremely unlucky and performed way worse than most of the green possibilities.
Moving forward… do you want to count on Mother Market to give system A the same extremely favorable luck? or do you want to bet on system B’s luck evening out?
I always assume I will be close to the average/median of the distribution moving forward which would put us at the peaks of both of these possibilities or distributions… if that is the assumption then the choice is clear.

Update Announcement

Build Alpha licenses now come with an instructional video series or course that goes over all the features and how to use the statistical tests the software offers. It makes spotting systems and their related distributions much easier than Build Alpha already makes it.
Thanks for reading,

Author

David Bergstrom – the guy behind Build Alpha. I have spent a decade-plus in the professional trading world working as a market maker and quantitative strategy developer at a high frequency trading firm with a Chicago Mercantile Exchange (CME) seat, consulting for Hedge Funds, Commodity Trading Advisors (CTAs), Family Offices and Registered Investment Advisors (RIAs). I am a self-taught programmer utilizing C++, C# and python with a statistics background specializing in data science, machine learning and trading strategy development. I have been featured on Chatwithtraders.com, Bettersystemtrader.com, Desiretotrade.com, Quantocracy, Traderlife.com, Seeitmarket.com, Benzinga, TradeStation, NinjaTrader and more. Most of my experience has led me to a series of repeatable processes to find, create, test and implement algorithmic trading ideas in a robust manner. Build Alpha is the culmination of this process from start to finish. Please reach out to me directly at any time.