What is Monte Carlo Simulation?

Monte Carlo Simulation is a statistical technique that injects randomness into a dataset to create probability distributions for better risk analysis and quantitative decision-making.
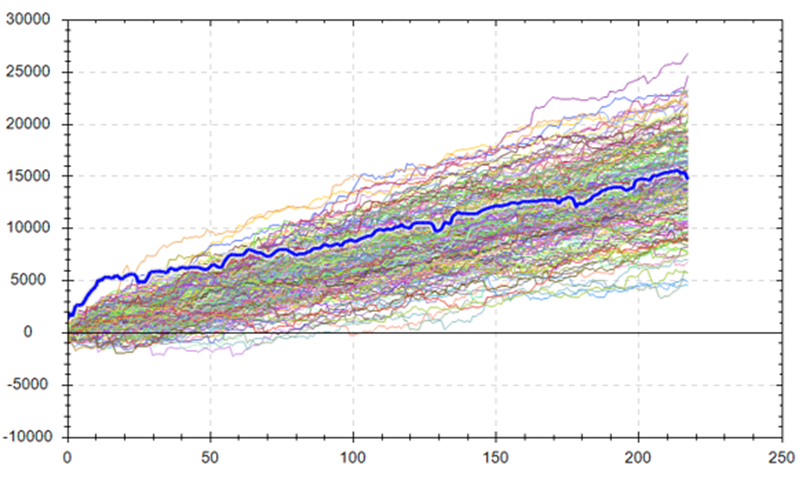
The most common Monte Carlo Simulation randomizes the order of a data set to demonstrate an alternative path a data set could have experienced – this is particularly useful for algorithmic traders and trading systems to see different outcomes of past trades.
In financial markets, quantitative traders use the most common Monte Carlo Simulation method to reshuffle the order of their historical trades to help them better understand how a trading system could have happened.
Algo traders aim to answer the question, if the order of trades was not identical to the backtest’s order, would I still be comfortable trading this strategy?
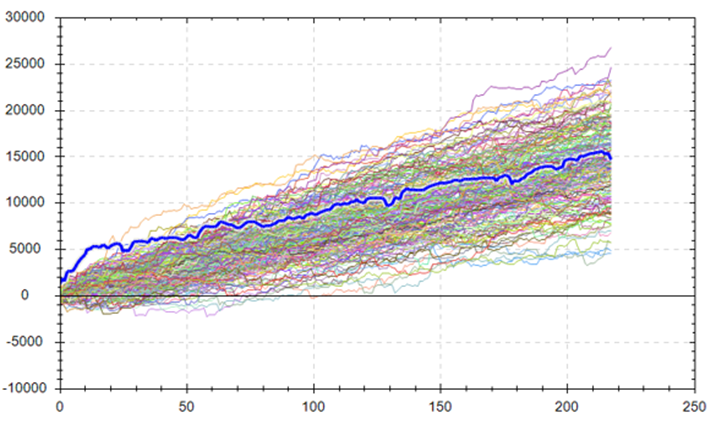
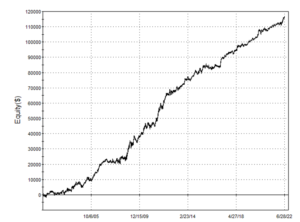
The equity curve, the cumulative profit of trade results, can provide insights into how smooth a trader’s account may grow following a particular algorithmic trading strategy. Monte Carlo provides a method of re-simulating the trading strategy to see how “bumpy” the ride could have been in an alternate reality and even acts as a peak into what the future may hold for the trading strategy.
The purpose of Monte Carlo Simulation is to detect lucky backtests and misleading performance metrics before risking real capital.
This video is a great introduction to Monte Carlo Methods: Monte Carlo Basics – Build Alpha

Why are Monte Carlo Simulations used?

Monte Carlo Simulations help better simulate the unknown and are typically applied to problems that have uncertainty such as: trading, insurance, options pricing, games of chance, etc. The goal is to gain a better understanding of all the possible outcomes and potential minimum and maximum values.
Traders use Monte Carlo simulations for a plethora of reasons from re-simulating trading systems to gaining a better understanding of the risk of a trading system.
Why re-simulate an equity curve? Algo traders use monte carlo simulations to determine how much luck was involved in a strategy’s backtest and if future performance is likely to look like past performance.
If the trading system was overly lucky, then it would be nice to know before risking real capital in live trading.
A trader may backtest a trading strategy and notice an acceptable maximum drawdown; however, after running a monte carlo test the drawdown may be much less tolerable. This Monte Carlo method could save the trader risking capital on a strategy he could not stomach in live trading.
The main uses for Monte Carlo simulations in trading simulation are:

Benefits of Monte Carlo Simulation

Better understanding of drawdown and future outcomes

reshuffling the order of your trades can lead to different profit and loss sequence which can result in a greater drawdown. A trader may believe the backtest’s drawdown is the worst it can get, but monte carlo analysis may show a much larger drawdown for most trading systems.

Properly fund your trading strategy

noticing a larger maximum drawdown from a monte carlo simulation can help a trader better capitalize a trading strategy. This can make a live drawdown more bearable and allow the trader to stick to the original plan. On the other hand, a trader that experiences a live drawdown greater than the backtest’s drawdown may prematurely turn off a trading strategy if not familiar with monte carlo simulations.

Understanding possible win and loss streaks

the backtest may show a maximum of 5 or 6 losing trades in a row but a monte carlo test may show that 8 or 9 losing trades in a row is possible. The trader can better prepare for this adverse situation equipped with the insights from a monte carlo simulation. Some traders may not be able to withstand consecutive losing trades and a monte carlo simulation may help traders avoid systems susceptible to such strings of losses.

Set better expectations with quantitative analysis

many traders view the backtest as a guide for what to expect. For example, a trading system shows an average trade of $500 so a trader assumes in 10 trades I should expect to make $5,000. However, a monte carlo test may show a wide range of possible profit and loss scenarios after 10 trades. This data analysis can help a trader remain calm enough to stick to the strategy when luck becomes favorable or unfavorable.

Monte Carlo Testing for Drawdowns

Beginner traders find a successful backtest and think they have struck gold. However, many beginning traders are misled by overly optimistic backtests. Often the most important performance metrics such as net profit, standard deviation of historical trades, and consecutive winning trades will be inflated.
The maximum drawdown from a backtest is often the most misleading metric!
Monte Carlo Analysis helps traders better estimate a strategy’s drawdown potential which can help traders stick to a strategy during inevitable drawdowns.
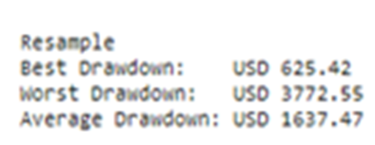
This example strategy below shows a backtest drawdown of $1,663.90.

However, after running a simple Monte Carlo Simulation on the same trading system we can see the worst resample drawdown from all simulations is $5,195.17 or 3.1 times as large as the backtest’s drawdown!
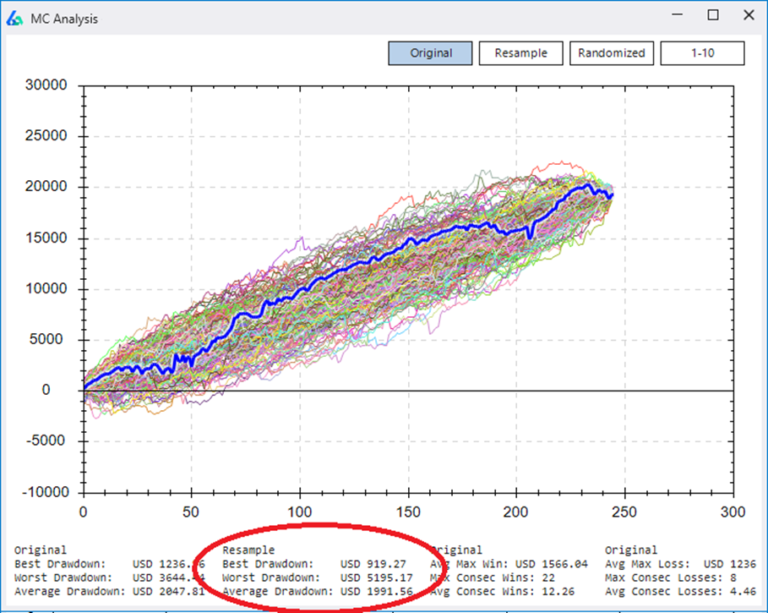
A trader sized based on the backtest would prematurely cease trading and turn a potential winning strategy off or not have enough capital allocated to properly trade this strategy. A simple monte carlo analysis could prevent this.

Monte Carlo Methods: Different types and uses

Reshuffle

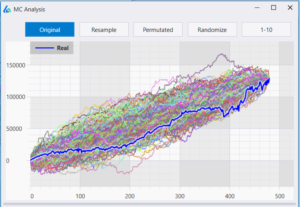
this monte carlo method reshuffles the historical trade order 1,000 times creating 1,000 new equity curves. Each equity curve has its own performance metrics such as maximum drawdown and consecutive losing trades. This method reshuffles the original trades, so all 1,000 equity curves end at the same total profit and loss amount.
Resample

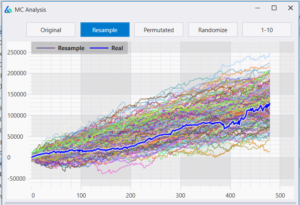
This monte carlo method continuously and randomly selects a historical trade with equal chance from all the trades until reaching the backtest’s trade count. This uses random sampling with replacement meaning the same trade can be selected and not every trade must be selected. This process is done 1,000 times to create 1,000 new equity curves. Each curve has its own performance metrics. However, resampling with replacement means not all simulations end at the same amount.
Randomized

The randomized monte carlo analysis technique re-trades the original strategy’s entries while randomizing each trade’s exit. The randomized exit only uses exit logic from the original strategy. That is, if the original strategy did not use a stop-loss then the randomized exit should not include a stop-loss. A strategy with a max hold of two bars may exit after one bar on the first trade but after three bars on the second, etc.
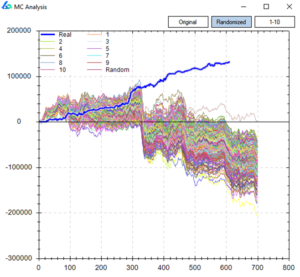
If the Randomized Monte Carlo results remain profitable, then it is likely our entry contains some true edge. The above example saved us from a lying backtest.
Read more on robustness testing for algorithmic trading strategies here: Robustness Tests for Algo Trading and please view a Randomized Test case study here: Free Friday 8 – Randomized Monte Carlo

Permutation

This monte carlo method applies to the historical data. First, we reshuffle the log of inter and intrabar price changes then exponentiate to recreate new bars. Re-trade our trading system on the 1,000 newly created synthetic data series.
The new permutated data contains the statistical properties of the original data but destroyed most of the patterns. Profitable results are a good sign the strategy is robust to withstand variations in the underlying data. It is a bonus to see our original trading system in the top trading results.
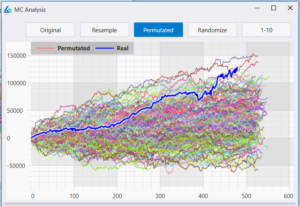
If the trading system fails on the permutated data or has many permutated results below or around $0 P&L, then it is time to find a new strategy and stop trading that system.

Advanced Uses of Monte Carlo Simulations for Trading Systems

Monte Carlo Equity Curve Bands

Is my trading strategy broken? If a trader wants to know his expected profit in the next 100 trades, then he can randomly select 100 historical trades and add them to the end of the backtest’s equity curve. Repeat this 1,000 times and keep the 5th and 95th percentile equity curves to represent where the trader should expect to be 90% of the time in the next 100 trades.
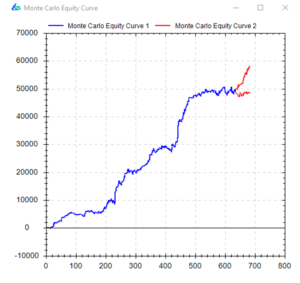
If future trading performance falls outside these monte carlo simulation equity bands, then it is an early warning sign the strategy is broken.

Monte Carlo Drawdown Technique

Monte Carlo Drawdown Technique answers the question, “how confident am I in this strategy’s drawdown”? This technique uses the monte carlo simulation resample method to create 1,000 new equity curves which simultaneously creates 1,000 new drawdown values.

We then plot the drawdowns as a histogram (green) along with a cumulative distribution line (blue). The blue line represents the total percentage of drawdowns as we move from left to right across the horizontal x-axis
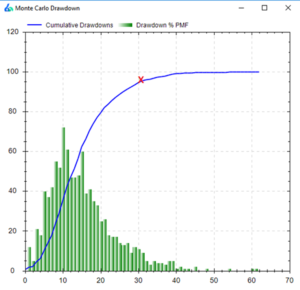
The red X indicates where 95% of all monte carlo drawdowns were less than the corresponding drawdown value on the x-axis. In this case we can say “we are 95% confident that drawdowns from this system will not exceed 30%”.
To improve the drawdown percentage, the trader should change the input variables. Either increase the starting capital allocated to the strategy or adjust the acceptable drawdown percentage. Understanding the drawdown probability distributions and sizing with statistical confidence can make drawdowns easier to manage.
To learn more please check out the Monte Carlo Drawdown Analysis section of the Complete Algorithmic Trading Guide or view this case study Properly Funding a Trading Strategy with Monte Carlo Drawdown.
Furthermore, I wrote an article for See It Market that covers the three primary uses of Monte Carlo Simulations: 3 Uses for Monte Carlo Simulations in Trading

How many Monte Carlo Simulations are needed?

The ideal number of monte carlo simulations for valid results are 1,000 or more. To truly leverage the law of large numbers and get reliable monte carlo simulation results one should strive for 1,000 or more simulations; however, results are generally acceptable with 100 or more simulations.
The purpose of monte carlo simulation is to detect lucky historical data backtests and misleading performance metrics in our trading ideas. However, running a single monte carlo simulation could create a lucky test result. Imagine a Resample test that luckily resamples only winning trades and creates an incredible equity curve.
Is this likely? No. Is this possible? Yes. Should we base trading decisions off of this?
No!
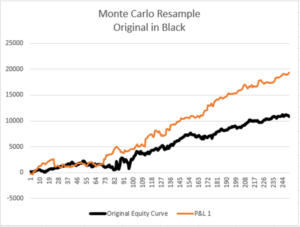
To avoid a lucky result like the above, we want to run 100 or 1,000 tests in order to ensure we have a good estimate of the median or average result. That is why all the monte carlo simulation images contain hundreds of equity curve lines.
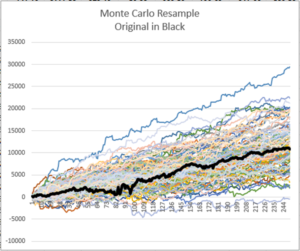
There still may be lucky results, but we can get a better sense of what is reasonable to expect from a larger probability distribution than a single simulation.

Equity Curve Simulator and Probability Distribution

An equity curve simulator is a tool that accepts winning percentage, average win, and average loss amounts to simulate how an equity curve’s sequence may happen. It is very important to note that a trader can be profitable with a lower winning percentage and larger winning trades or with smaller winning trades and a higher winning percentage.
To learn more about expected value please check out the complete guide to Algorithmic Trading.
Look at this this expected value display below to see how winning percentage and average win to loss ratio affect profitability:
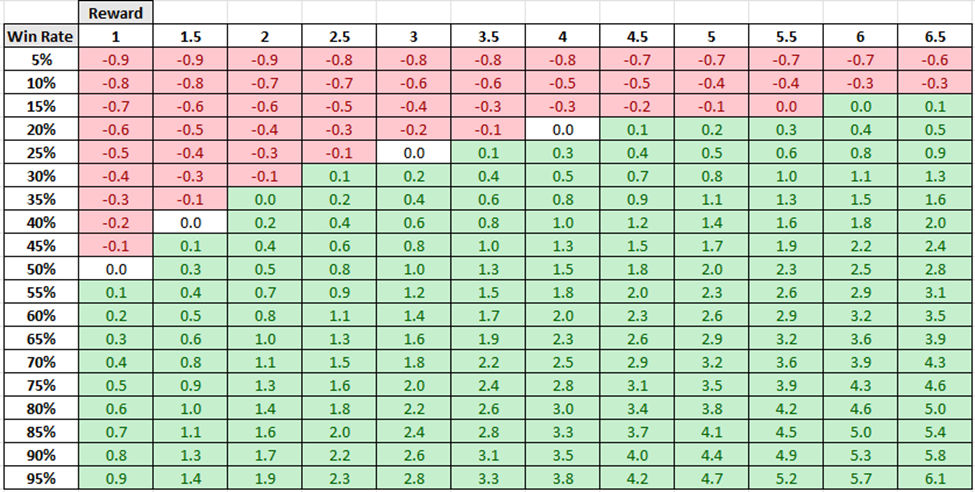
All values based on $1 risk. 2.5 Reward indicates a profit of $2.5 and a loss of $1
I have built a free equity curve simulator where you can input your expected winning percentage, average winning trade and average losing trade to simulate your expected equity curves.
Knowing how these values cooperate can help with algorithmic trading strategy design, risk management, avoid a poor strategy, and analyze trading results.

Monte Carlo Simulation Excel

Microsoft Excel is often good enough for simple quantitative trading endeavors. I have built a simple excel monte carlo simulation that you can import your trades and simulate various equity curve paths.
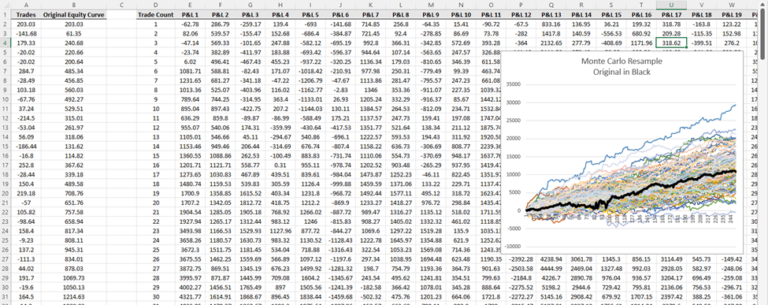
Simply copy and paste your trades into column A and it will generate your equity curve in column B. Then drag columns D:N down to end at the same row number as total trade count. That is, column A and columns D:N should end at the same row. Then to simulate a new monte carlo test press ‘F9’.
To download this Microsoft Excel Monte Carlo spreadsheet please visit here: link and to read more about monte carlo simulation from Microsoft please head here: Introduction to Monte Carlo simulation in Excel (microsoft.com)

Algo Trading Software for Monte Carlo Analysis: Build Alpha – The Best Monte Carlo Tool

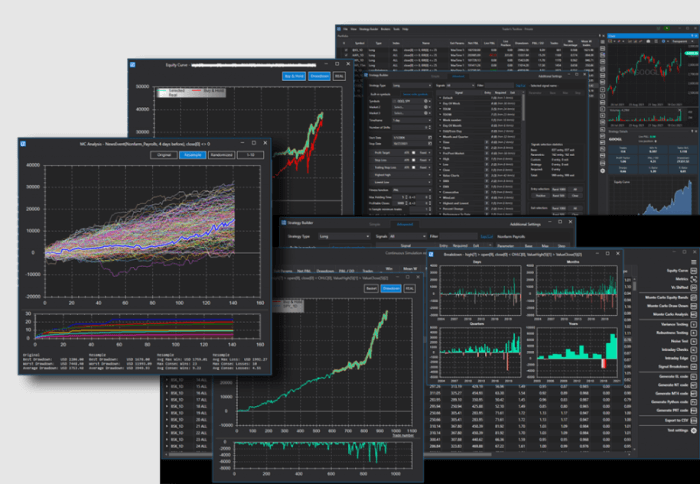
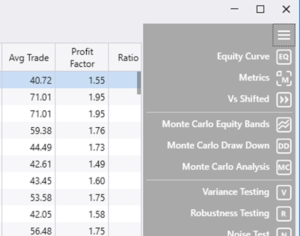
Build Alpha is powerful automated trading software that enables traders to create hundreds of algorithmic trading strategies with no programming needed. Any strategy created can be put through all the Monte Carlo methods listed in this guide. Simply highlight the desired strategy in the results window, then select the Monte Carlo Analysis option on the right-hand side.
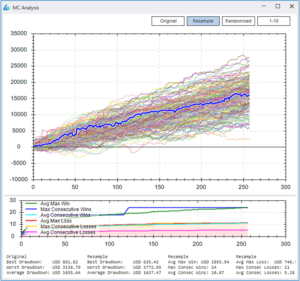
Build Alpha also returns statistics on winning and losing streaks from the simulations. This can help a trader understand what to expect as consecutive winning or losing trades occur.
You will see additional buttons on the right-hand side for the advanced monte carlo methods of Monte Carlo Equity Bands and Drawdowns.
What is the best Monte Carlo Simulation?

There is no best method as each has different intended uses for the algo trader. For example, the reshuffle and resample are primarily used to get a better estimate of drawdown and risk analysis.
On the other hand, randomized and permutation tests are used for strategy robustness and future viability. These can be thought of as stress tests for a trading system.
Monte Carlo Drawdown technique is similar to reshuffle and resample but puts an emphasis on creating confidence intervals around the actual expected drawdown.
Finally, the monte carlo equity bands or probability cones are used to monitor live trading and identify broken strategies. There is no best monte carlo method as a professional quant trader should incorporate all into the strategy development process.

Key Takeaways

Monte Carlo Method Need to Knows

Monte Carlo Summary for Algo Trading

Monte Carlo Simulation work in various ways. The most popular monte carlo methods are used to help traders identify luck and more appropriate drawdown measures than a simple backtest can provide. Reshuffle and resample monte carlo methods help traders simulate various equity curves with alternative trade sequences to view potential outcomes occurring.
Monte Carlo Randomized and Permutation tests aim to test strategy robustness and act as a stress test to trading strategies prior to real risk taking. Monte Carlo equity bands aid traders in identifying early signs of a broken strategy. Finally, MC Drawdown assists traders find proper confidence intervals around drawdowns to ensure the strategy is funded with enough capital for the trader’s risk tolerances.
Monte Carlo Simulations are arguably the most popular quantitative trading tool to add to your algorithmic trading toolbox. More advanced readers can experiment with altering the probability density function or random number generator to make MC selections. I will save this and other variables for another discussion.

Author

David Bergstrom – the guy behind Build Alpha. I have spent a decade-plus in the professional trading world working as a market maker and quantitative strategy developer at a high frequency trading firm with a Chicago Mercantile Exchange (CME) seat, consulting for Hedge Funds, Commodity Trading Advisors (CTAs), Family Offices and Registered Investment Advisors (RIAs). I am a self-taught programmer utilizing C++, C# and python with a statistics background specializing in data science, machine learning and trading strategy development. I have been featured on Chatwithtraders.com, Bettersystemtrader.com, Desiretotrade.com, Quantocracy, Traderlife.com, Seeitmarket.com, Benzinga, TradeStation, NinjaTrader and more. Most of my experience has led me to a series of repeatable processes to find, create, test and implement algorithmic trading ideas in a robust manner. Build Alpha is the culmination of this process from start to finish. Please reach out to me directly at any time.
Jump ahead to the free web based backtester

What is Backtesting?

Backtesting is applying a trading strategy on historical market data to view how a particular strategy would have performed in the past. A backtest will return the hypothetical total profit, a list of historical trades, and many other performance metrics to analyze a trading system’s potential viability in financial markets.
For example, we can take the past ten years of data and apply our strategy – in hindsight – to view how the strategy would have performed over these past ten years. The backtest’s results can help drive trading decisions such as:

What is Backtesting Used For?

Backtesting gives traders and investors a sense of a strategy’s profitability on historical data which may give insights into how the strategy can be expected to perform in the future.
However, please note, all disclaimers in financial markets will warn that historical performance is not indicative of future performance. However, seeing positive past performance can grant a trader confidence.
In short, backtesting is testing trading opportunities on historical data to assess the historical profitability of a trading strategy or market environment.
Backtesting can be used to check the viability of a single trading system, gain a better understanding of how a strategy would perform during certain market environments, or to compare competing trading signals when capital may be limited.

Why is Backtesting Important?

Backtesting provides a way to analyze risk prior to risking real capital. The immediate insights a backtest provides can potentially save the trader money by helping him avoid a potential losing strategy.
If a trading strategy performs poorly, losing money during a backtest, then there should be less incentive to live trade the strategy with real capital as it may result in losing money rapidly.
On the other hand, a good backtest should be a requirement for risking capital. This does not mean that a good backtest is a greenlight to bet the farm, but a trader should desire to see a profitable backtest before committing real capital.
Backtesting provides important performance statistics of a potential trading strategy such as:
All these insights can better help prepare the trader for live trading the strategy, the risks involved, gain confidence, or choosing between two competing strategies which all help contribute to long-term success.

What do you need for Backtesting a Trading Strategy?

There are only two things you need to conduct a proper backtest:
These two points are enough to conduct manual backtesting where you can replay the charts, view where you would have entered, and track your strategy on paper or with virtual money. This is often enough for testing purposes before you start trading. A bit more on these two points below.

Historical Data Needed for Backtesting

What kind of Data is needed for backtesting?

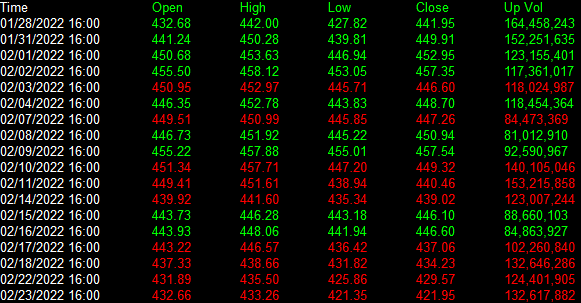
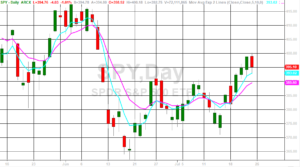
The most important element for running a backtest is historical financial data. Financial data normally comes as a time series in OHLC or open, high, low, close format. Below is an example of historical SPY data.

Resources for Free Financial Data

How much data is needed for backtesting

The goal is to get enough trades from the backtest to feel confident the trades were not lucky and perhaps find an effective trading strategy.
For example, if you flip a coin 10 times and get seven heads then we cannot determine if the coin is rigged. However, if we flip the coin 10,000 times and get 7,000 heads then we can be sure the coin is rigged.
This is because as the sample size increases, we should converge toward the expected value. This mathematical concept is known as the Law of Large Numbers. I give a full breakdown in my Robust Trading Strategies Guide.
We really want to see at least 100 trades or more to avoid “luck” playing a role. Note this is a rule of thumb and not a steadfast number. If our strategy trades once per month then we would need 100 months of data or roughly eight years. However, if our strategy trades more frequently then you can backtest with smaller data histories.

Bull and Bear Data

There are many other considerations such as all data coming from a bull market or should data be from both a bull and bear market, etc.? However, these advanced questions are answered in the above-mentioned guide.
For now, we need enough data to generate enough trades. This should be your only concern.

Backtesting different time periods and market conditions

It is wise to include different time periods or market environments in your backtest. For example, a long breakout strategy may do well in a bull market and poorly in a bear market. If your backtest only contains historical data during a bull market, we may be deceived into believing we have found a holy grail. Does it work on another time period?

Backtesting different markets

Do you need stock market data if you are testing a forex strategy? A forex trading strategy may only require currency pair data and fx traders may have no need for stock or future data. Trading cfds and futures or stocks may require different data sets or time periods but a strategy that backtests well across different markets can be a reliable indicator to future results. Quantitative strategies that perform well across financial instruments, showing similar performance on various symbols, can be a key component to success.

Finding Trading Ideas for Backtesting

If you have been around the markets long enough, you will begin to create your own trading ideas but there are various other ways to quickly stumble upon trading ideas to backtest. Below are some basic steps to sourcing new trading ideas.

Screen Time

The more time you spend watching live market charts and order books the more patterns you will identify. These patterns are great ideas to test for viable trading strategies.

Trading Books

Most naïve traders make false claims about trading books, “if this was profitable why would the author write about it”? In reality, there are many great trading books and ideas out there.

Trading Papers

Brilliant researchers publish white papers and research papers that leave hints, ideas, trading methods, and further areas to research. Arxiv.org is a great resource and even has a quantitative finance filter.

Technical Indicators

Viewing technical analysis indicators can give insights into how other traders are looking to summarize trading concepts. These can be incorporated into your own strategies and backtests.

Alternative Data

Using alternative data can help add context to price action signals or provide new trading ideas. For example, companies that have many job openings and listings may be expanding quickly!

Genetic Algorithm or Machine Learning

A genetic algorithm takes massive amounts of inputs and attempts to mix and match to find the best possible combinations (crude simplification). In theory, it is generating new ideas for you. This is the core behind Build Alpha no code algo trading software which I will describe later.
Machine learning works in much the same way and can also be thought of as a way to create new trading ideas or a predictive model.

Backtesting Programming Language or Software

To apply our trading idea on the historical data to complete our backtest we need some type of programming language or software. Below are the best options for both new and advanced backtesters.

Backtesting in Excel

Microsoft excel is excellent for quick and easy backtesting. I wrote a full example here: Backtesting in Excel. In short, here is a quick example on SPY that buys when price closes in the bottom 20% of the day’s range and sells the next day.

Backtesting with Python

Python is the fastest growing programming language due to its easy to learn syntax and easy to read coding style. Python has many various libraries (publicly available code) you can incorporate into your own code to create technical indicators, run scenario analysis, backtest and more. Here are a few favorites:

Backtesting with C++

C++ is much faster than python and primarily used by high frequency traders to backtest terabytes of tick data and more. However, C++ is much more complex to learn and harder to read. If you are new to programming this language has a steep learning curve but is worth it once mastered.

No Code Backtesting Software

For those that do not want to be limited by excel or learn a programming language then I would highly recommend Build Alpha as backtesting software. Manual backtesting can be a time-consuming process. With a little computing power, Build Alpha’s automated backtesting engine can test hundreds of thousands of strategies per second.
Build Alpha also has 6,000+ built-in entry and exit signals, the ability to create your own signals, and advaned robustness tests to identify lying backtests.
The best part is Build Alpha is completely code free and requires no programming! I will share more on Build Alpha below.

Backtesting Trading Strategies Example

Let’s backtest a trading strategy. Actually, let’s backtest three simple trading ideas so we can see the results, what a sample trade looks like, and more.
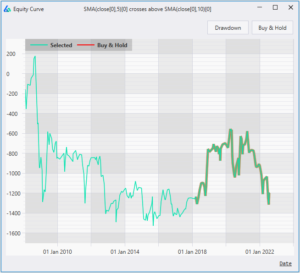
First, let’s backtest a moving average crossover. Let’s buy when the 5-period simple moving average (SMA) crosses above the 10-period SMA. We will sell when the 5-period SMA crosses below the 10-period SMA. Here is a simple image of the entry and exit signal.
Below is a sample equity curve applying this strategy to SPY historical data over the time period 2008 to 2022. Obviously not confidence inspiring.
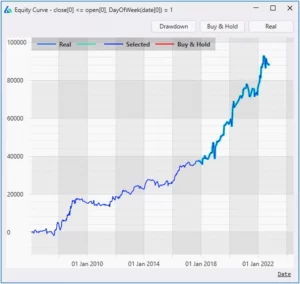
The second strategy will buy SP500 futures e-mini contract after a negative Monday and hold for one day. This strategy is known as “Turnaround Tuesday” which I originally wrote about in 2017. Let’s check performance since then using Build Alpha automated software to backtest a trading strategy.
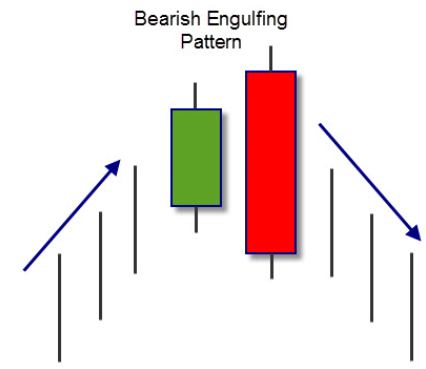
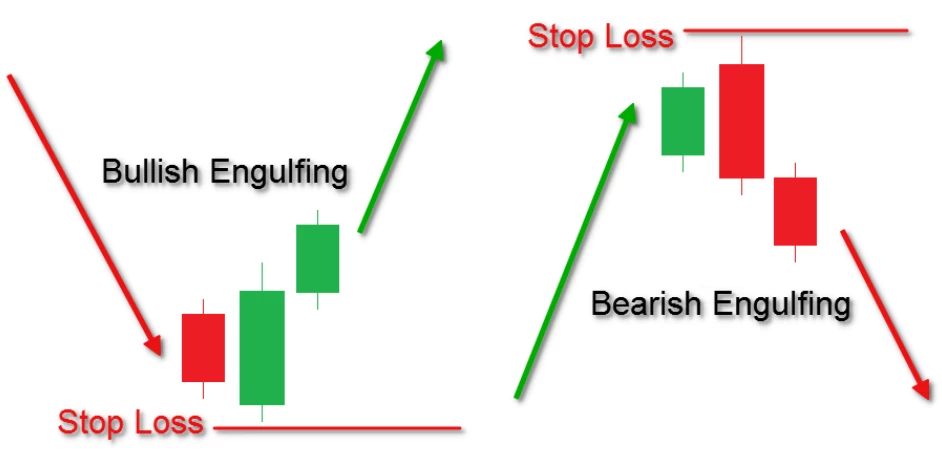
Finally, let’s buy SPY after a bearish engulfing candle and hold for one day. This strategy was originally published in 2017 where I exposed some market “truths” that could be debunked with backtesting. Let’s check performance to see if it has maintained its stellar win percentage. Spoiler: it has with a 62%-win rate since 2017 following a “bearish” engulfing candle.

Analyzing Backtest Performance

In the above examples we viewed different metrics. In the first two, we viewed total profit via the equity curve, and in the third example we viewed winning percentage.
What are the best backtest performance metrics and how can we compare trading strategies after viewing backtesting results?

Main backtest performance metrics

Calculating Sharpe Ratio

According to Investopedia, Sharpe ratio is a measure of risk-adjusted return and describes how much excess return you receive for the volatility of holding the riskier asset. It is calculated as the return minus the risk-free rate divided by the standard deviation to achieve that return. The higher the Sharpe ratio the better. Risk-adjust returns are a great way to compare strategies.

Sharpe Ratio Calculator

Below is a free Sharpe Ratio calculator where you can enter your backtest’s return percentage and standard deviation to calculate your Sharpe Ratio. Play around and see how return and volatility coexist.

Free Web Based Backtester! Backtesting with no code.

This simple web backtester will let you create and test your own ideas. It lacks a lot of the features and functionality that Build Alpha Algo Trading Software (mentioned later) has but will help you get started backtesting with no coding or data retrieval. For those of you serious about backtesting, strategy development, strategy validation and more please check out Build Alpha and speed up your learning curve.
But for now… test for free. Please share and be kind.

Backtesting Benefits

There are five major benefits to backtesting a given strategy. Below I cover each one.

1. Helps avoid bad strategies

Backtesting a strategy before risking capital can help avoid losing strategies that stand zero chance to make a profit and will perform poorly in live trading.

2. Paper trading

Backtesting can help a trader visualize what following a trading strategy would be like. Finding a strategy that matches your personality can be a benefit to long-term success. Utilizing a risk-free demo account to conduct paper trading to gain confidence is an excellent idea before risking money.

3. Evaluate different market conditions

Backtesting enables traders to analyze a strategy on different market conditions from different historical data periods. How does this strategy do during the 2008 Great Financial Crisis? How does it do during a strong bull run from 2013 to 2015? How did it do during the Covid drop of 2020 or some future market conditions we do not know yet?
Additionally, intraday strategies can be evaluated on different days of the week or during different time windows.

4. Set proper expectations

Backtest results can help traders understand how profit and loss expectations should be set and engage in smarter money management. If a strategy earned $10,000 per 100 shares per year, then expecting a strategy to make $1,000,000 on 100 shares next year would be unreasonable investment research.
Moreover, noticing a steep drawdown during a backtest can help a trader properly fund a strategy prior to going live.
I spoke more about setting proper expectations here: Monte Carlo Analysis and Drawdowns

5. Compare Strategies

Not all traders have unlimited capital and must choose between strategies. Backtests can help traders understand where and when their capital is best put to use. Spread bets, algo trading, futures, stock gappers, trading cfds, etc. can all be compared objectively.

Backtesting Pitfalls and Common Mistakes

Poor backtest results often indicate a strategy unworthy of live trading. However, good backtest results are not a greenlight to live trade. There are a handful of backtesting pitfalls we must watch. Some backtests may be too good to be true!

Overfitting or Curve Fitting Backtesting Risk

Over optimization or curve fitting is finding a trading strategy that too closely fits the historical data and will fail to adapt to new data. The strategy essentially learns the nuances of the historical data during the backtest but fails on new data when the exact nuances do not play out exactly as they did in the previous time period.
Overfitting is the largest risk system traders face. Overoptimizing parameters to improve backtest results can lead to great test results and good emotions, but horrible live trading performance.
There are many advanced techniques to overcome this pitfall which I wrote about here:  Curve Fitting – Build Alpha

Look Ahead Bias

Another backtesting pitfall, look ahead bias, is using data that was not known at the time of the historical trade. A tragic example of look ahead bias in a multi-timeframe strategy would be using the daily close to make a trading decision midday. At the time of the trade, midday, it is impossible to know the close of the same day.
These look ahead bias risks are often negated and removed with proper data cleaning or professional grade automated backtesting software.

Survivorship Bias

Running a backtest on only currently traded symbols introduces too much optimism in the backtest results as it can avoid buying stocks that eventually went bankrupt or delisted. This phenomenon is known as survivorship bias.
Much like look ahead bias, survivorship bias deals with underlying historical data issues. Many data providers only have symbols currently listed on exchanges. A proper backtest should consider all symbols that were available at all historical dates and times. This includes stocks that went bankrupt, merged, went private or delisted.
Additionally, choosing to run a backtest on only the best stocks also introduces survivorship bias. The best stocks cannot be known ahead of time and undoubtedly leads to overly optimistic results. If we could identify AAPL or GOOGL ten years ago then your personal finance situation would be significantly different.
We must be unbiased in our symbol universe selection to have truly reliable backtest results. Ask your data provider if they provide listed and delisted securities!

Ignoring Transaction Costs

Backtesting a trading strategy without transaction costs such as slippage or commissions can mislead traders into believing unrealistic backtesting results thus depleting their accounts in live trading.
Backtest results can show an average trade of $10 or $15 but in real markets where slippage and commissions are present the average trade may be negative.
Ignoring trading costs during backtesting can find unrealistic and unobtainable results. Always include transaction costs in your backtests for reliable results!

Backtesting vs. Forward Testing

Forward testing is creating a trading strategy and allowing it to trade on live data on a paper or simulated account. Some forward test in a real account with small size. Many traders view forward testing as a necessary component of moving a strategy from the research stage to the live trading phase.
Backtesting is great for quickly identifying the viability of a trading strategy. Forward testing creates the same hypothetical results but on new data. Forward testing takes more time but is done on the most recent data.
There is no need for a trader to choose one or the other as both can have their place in a proper strategy pipeline; however, forward testing is often not necessary if statistical significance can be obtained during the backtesting phase and rigorous robustness testing is applied.

Backtesting Portfolio

In financial markets, backtesting single trading strategies is a tremendous achievement and necessary for trading system developers. However, backtesting a portfolio of strategies goes one step farther.
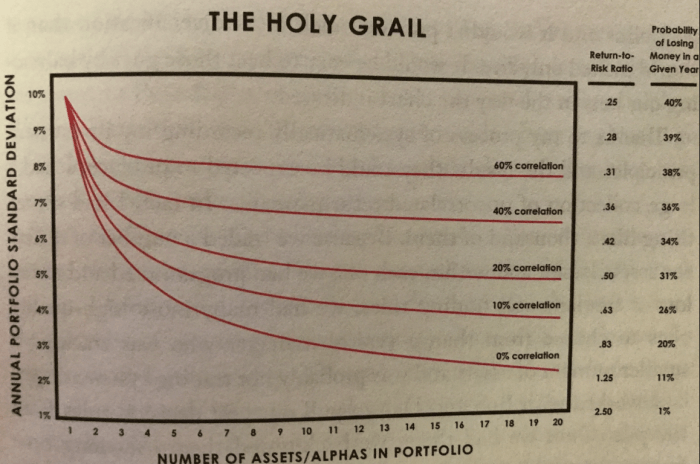
Ray Dalio, founder of Bridgewater – the world’s largest Hedge Fund, released a compelling graphic demonstrating the math behind combining multiple strategies together.
The graphic shows the more uncorrelated strategies one can combine, the lower the probability of losing money in a given year. Wow! This epiphany is a true key to algo trading success. I wrote about it here: Algorithmic Trading Complete Guide.
That being said, it is important to have the ability or software to backtest portfolios of strategies not just single strategies. This was a key driver behind Build Alpha’s Portfolio Mode upgrade.

Advanced Backtesting Techniques

Due to the various pitfalls and brilliant minds in quantitative finance, various advanced techniques have been created to identify more reliable backtest results which hopefully lead to more sustainable live trading performance.

Out of Sample Testing (OOS)

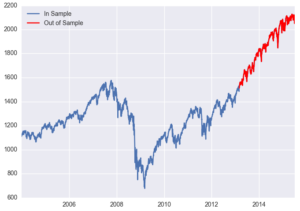
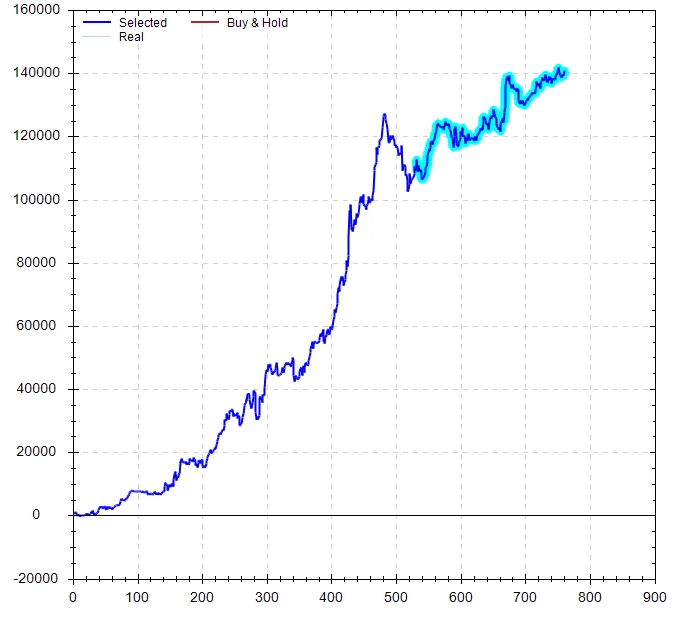
Out of Sample testing is withholding some historical data for future testing – typically some percentage. First, develop and tweak your trading strategy on the In-Sample data. Once you have achieved desirable backtest results you can test your strategy on the withheld out of sample data.
Ideally, performance results should be similar in both the in-sample and out-of-sample data periods. If trading performance fails on the out of sample data, then we likely avoided an overfit or poor strategy.
I wrote more exclusively about this test here: Out of Sample Testing

Randomized Out of Sample Testing

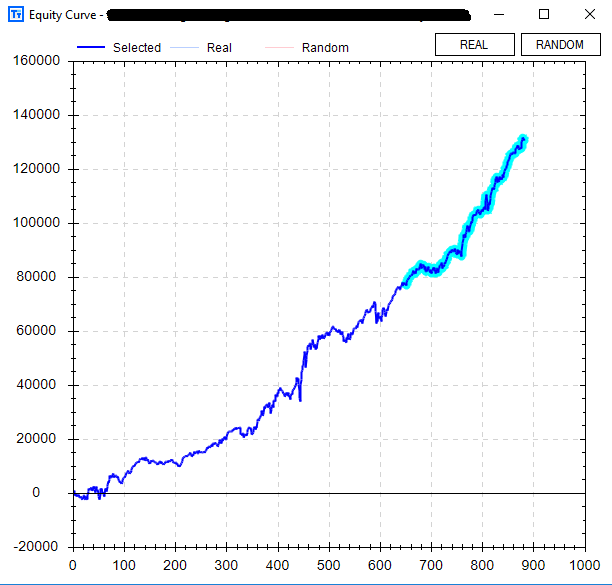
Selecting the proper out of sample period is a challenge to creating reliable backtest results. What if you select an out of sample period that contains only a bull market (like the image above)? The out of sample test may be easy to pass. Randomized out of sample testing can help avoid this.
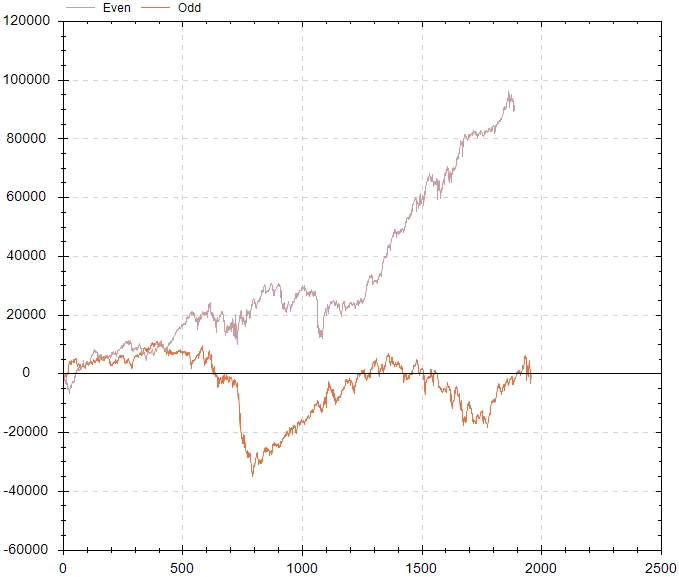
Randomized Out of Sample testing randomly selects non-congruent dates from your historical data set to be part of the out of sample period.
The trader can create 1,000 or more randomized out of sample periods then compare results on all of them. This helps overcome randomly selecting data points from a bull market only. Learn more about Randomized Out of Sample.

Lying Backtests. Are backtests enough?

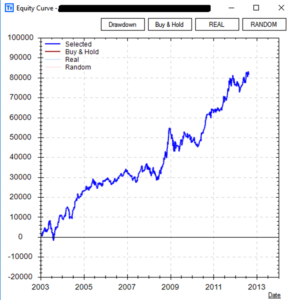
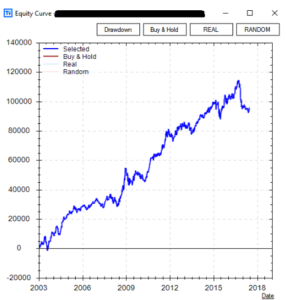
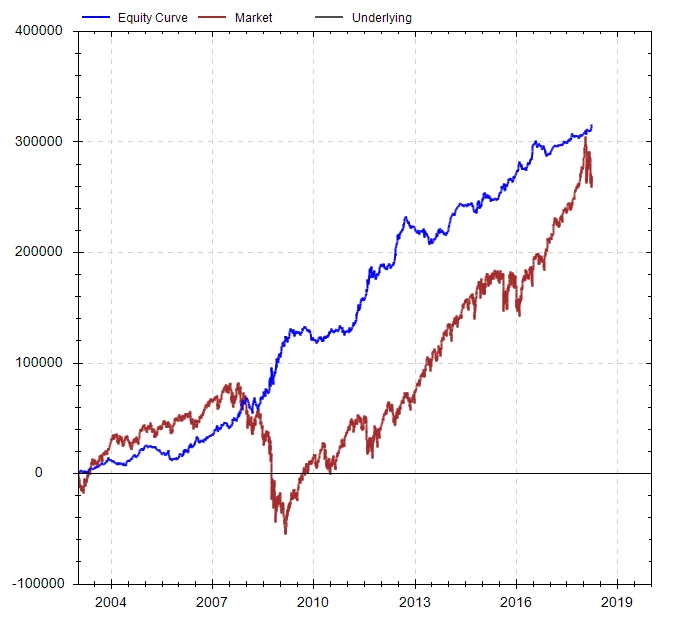
Let’s discuss a simple case study that uses intermarket signals from the Japanese Yen to trade US 30-year bond futures. The strategy has only 2 rules for entry and produces fairly stable in-sample returns for being so simple (2003-2012 backtesting period).
Graph shown shows results based trading 1 contract per signal for demonstration purposes
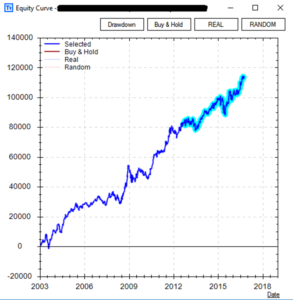
The intermarket strategy performed quite well on the unseen, out of sample data (2012-2016 OOS). The ability for a strategy to continue to perform on unseen data is paramount and mission critical for many system traders and strategy architects.
Graph shown shows results based on 1 contract per signal for demonstration purposes
However, can we trust this backtest? In Build Alpha, there are many validation and robustness tests that can add confidence to your system development and backtesting process.
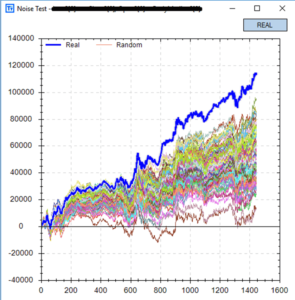
There is a special test called the “Noise Test” which creates 1,000 new price series by adding and subtracting varying amounts of noise (read volatility) from the historical data. The test then “re-trades” the strategy on the new 1,000 price series.
The idea is that if a strategy is overfit then it is overfit to the noise of the original data and is not trading the underlying signal we hope it is. Changing the noise will reduce performance if the strategy is overfit to the noise of the original data. Ideally, we want to see a strategy continue to perform well on the new, noise-adjusted price series.
This “Noise Test” can help prevent a backtest from lying to us and hopefully prevent us from wasting further research time or taking a weak strategy live! You can see that our original backtest in blue is significantly better than the 1,000 “Noise Test” results. This is worrisome and most likely a sign of an overfit strategy aka a lying backtest that will surely fail on live data.
Viewing this simple strategy’s performance since 2016 confirms the value of the Noise Test. The strategy has been in a nosedive since going “live”, but a smart trader would have never taken it live – no matter how pretty the backtest – due to the failed Noise Test.
Noise Test Strategy Failing Robustness Check
Any kind of trading – manual or discretionary – should be subjected to these rigorous tests before getting real money allocations. If not, you may be in for a surprise from a lying backtest or unreproducible hypothetical returns!
To read the full article, please check out The Noise Test and Lying Backtests; additionally, I wrote about the Noise Test here: Noise Testing

Best Backtesting Software

Build Alpha is the best backtesting software available. To manually backtest trading strategies is a time consuming and error prone process. Build Alpha enables the trader to test any and all ideas in a few clicks and requires no coding or programming. Build Alpha also offers the most advanced validation and robustness tests to help identify lying backtests as this has been the focal point of my professional trading career.
Build Alpha’s genetic algorithm can take thousands of input signals, exit ideas, risk management rules, and more to find the best trading strategies for you. The robustness checks and tests give the ability to analyze any backtest result in depth before risking real capital. Portfolio mode allows for traders to combine strategies and backtest portfolios. To learn more head over to the Build Alpha homepage or sign up to see the demo.

Backtesting Need to Knows

Summary

Many traders implement trading strategies without testing them which often leads to depleted retail investor accounts. Backtesting enables traders to visualize historical performance of any trading strategy prior to risking real capital. Traders only need market data and a trading idea to conduct a proper backtest. A backtest can be used to weed out poor strategies, identify those worthy of future research, compare competing strategies, and more. Backtesting is a vital tool in any serious trader’s repertoire but is not a be all, end all to print money. Backtesting is a great first step, but other validation methods are needed before one should risk real capital.

Author

David Bergstrom – the guy behind Build Alpha. I have spent a decade-plus in the professional trading world working as a market maker and quantitative strategy developer at a high frequency trading firm with a Chicago Mercantile Exchange (CME) seat, consulting for Hedge Funds, Commodity Trading Advisors (CTAs), Family Offices and Registered Investment Advisors (RIAs). I am a self-taught programmer utilizing C++, C# and python with a statistics background specializing in data science, machine learning and trading strategy development. I have been featured on Chatwithtraders.com, Bettersystemtrader.com, Desiretotrade.com, Quantocracy, Traderlife.com, Seeitmarket.com, Benzinga, TradeStation, NinjaTrader and more. Most of my experience has led me to a series of repeatable processes to find, create, test and implement algorithmic trading ideas in a robust manner. Build Alpha is the culmination of this process from start to finish. Please reach out to me directly at any time.
It is no secret that many traders fail to achieve success and a level of consistency. The persistent traders will eventually understand they need to quantify what their edge is. This inevitably leads them down the road of systematic or quantitative trading but with no direction on how to begin.
I am often asked how to build an automated trading system or how to create a trading algorithm or become a software trader. In this post, I will walk through testing a simple two rule system for the SP500 using Excel, Python and Build Alpha. The goal is to show how simple investigating quantifiable edges can be.

I will use the same simple trading algo idea in all three platforms to hopefully show some algo trading 101 level steps in each platform. The strategy will buy when IBR (defined later) is less than 20 and the closing price is below the 10-period simple moving average. It will hold for 1 day and will not have any position sizing or risk management. Very simple to create.

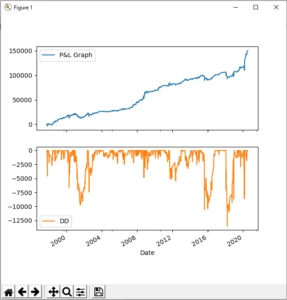
We will also create visuals for the equity curve (P&L graph) and drawdown.

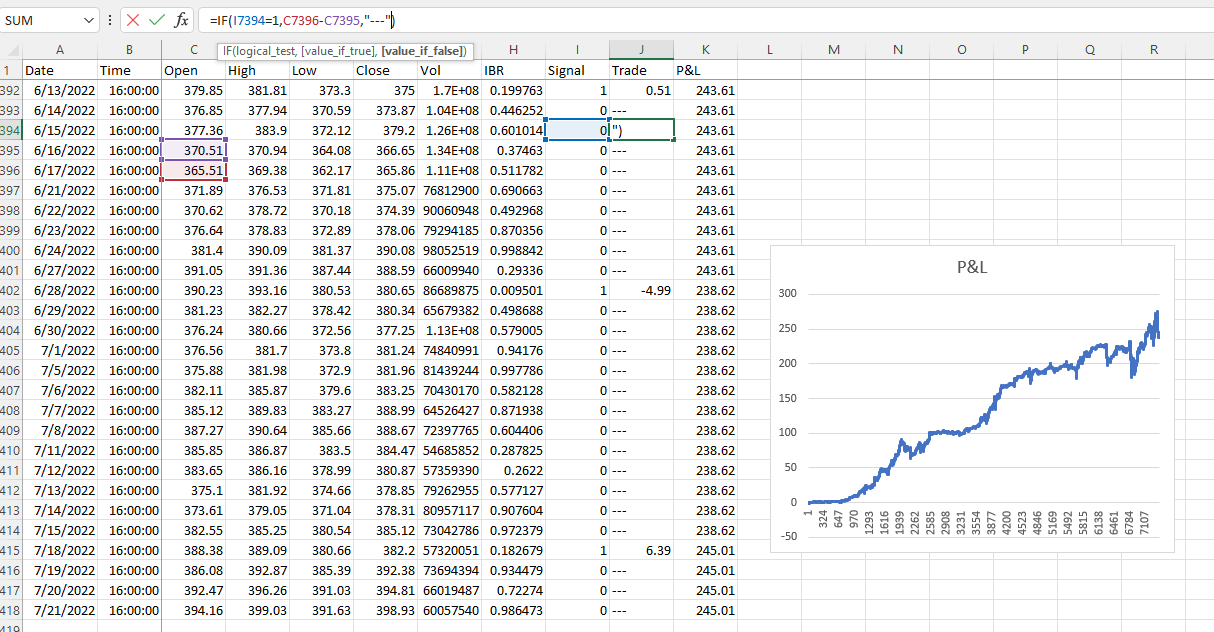
How to Create a Trading Algo in Excel

Starting with excel makes the most sense as the majority will be most familiar with it. I will share many screenshots and explain the steps one by one on how to do backtesting in excel. This is a simple example – no risk management stock trading excel example yet. So if you are an excel expert this may feel like a slow walk in the park – that is by design!
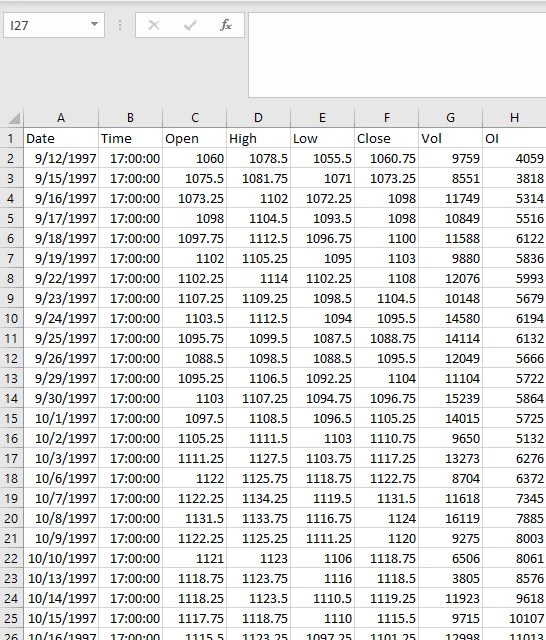
Step 1: Open the data file in Excel. Finance data is almost always going to be displayed in this format of Date, Time, Open, High, Low, Close, Volume (and Open Interest if futures or options). It is often referred to as OHLCV data.
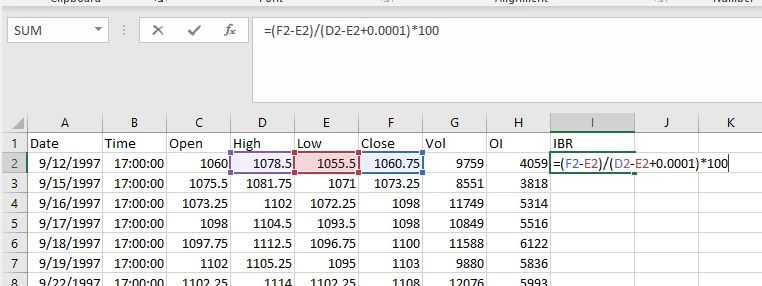
Step 2: Calculate IBR or Interbar Rank. This is sometimes referred to as IBS or Interbar strength. It is a 1 period stochastics where we view where the close is in relation to the bar’s trading range. An IBR of 20% or lower would mean the close was in the lower 20% of the bar’s range.
The formula is simple and can be seen below. It is the difference between the close and the low of the bar divided by the range of the bar. Please note I added 0.0001 to the denominator to avoid any divide by 0 errors when/if the high and low are equal to each other. I have also multiplied IBR by 100 in order to express it as a percent.
After typing in the formula, drag this value down for all rows of data in order to calculate the IBR for each bar.
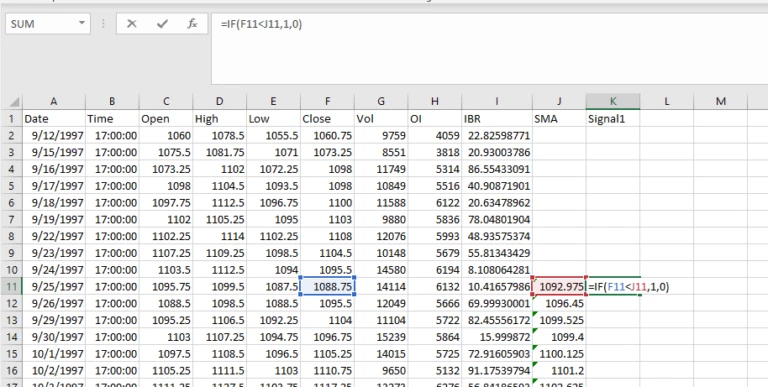
Step 3: Calculate the 10 period Simple Moving Average. Go down to the 10th bar and add the formula below. Drag this down for all rows of data to calculate the 10SMA for each bar.
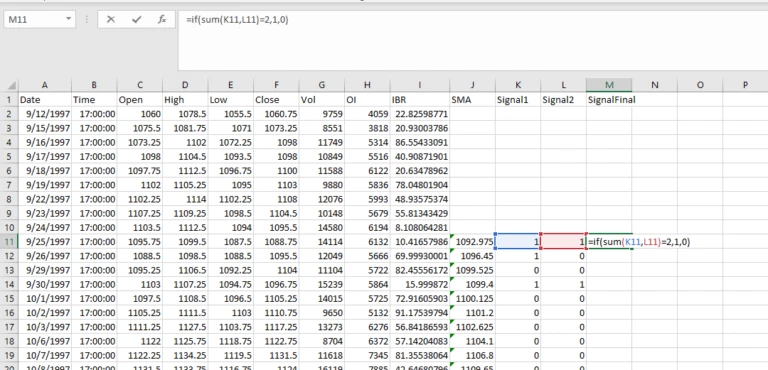
Step 4: Let’s add a new column and calculate our 10 period SMA signal. I have named this column Signal1. We will check if the current close is below the current SMA.
In order to check this, we can use an excel if statement. If the close is below the SMA return a 1 else return a 0.
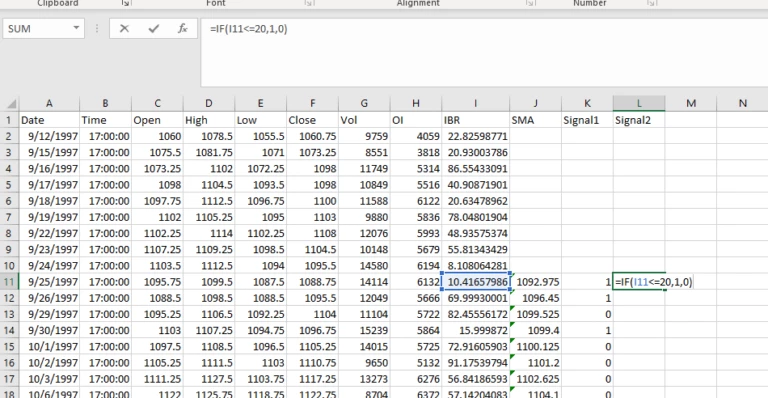
Step 5: Adding another column named Signal2 in order to calculate our IBR signal. Again using an if statement to check if the current IBR is less than or equal to 20%. That is, if the current bar’s IBR is less than 20% return a 1 else return a 0.
Step 6: We need to combine our two signals into one signal. That is, whenever we close below the 10 SMA and have a weak close in the bottom 20% of the day’s range we want to return a 1 otherwise return a 0. A 1 would mean a green light to trade and a 0 would sit us on the sidelines as we have no edge.
All we need to do is check the sum of the previous two columns we created. If their sum is 2 then we return a 1 else we return a 0.
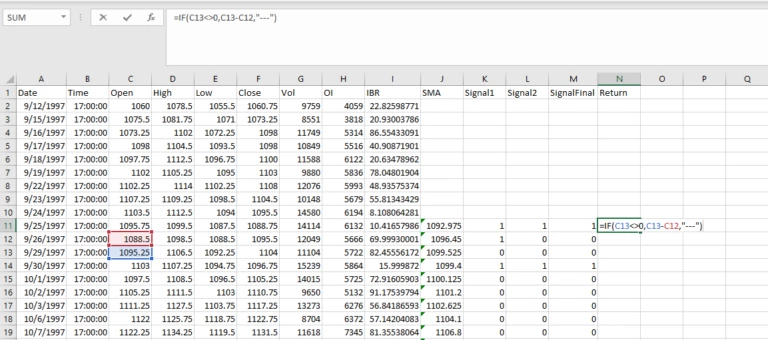
Step 7: Next let’s calculate the raw one day returns on the SP500. We have been using the closing price in all of our signals so we cannot truly know if our signal(s) are true until the close of the bar. Thus we cannot enter until the next bar’s open.
Let’s assume we get a true signal on Monday’s close. We would then enter on Tuesday’s open and hold for one bar exiting on Wednesday’s open. We could exit on Tuesday’s close but for simplicity’s sake we won’t in this example.
Our excel function checks if we have data the next two days by checking if the opening price is non-zero and exists. If we have data, we can then subtract tomorrow’s open from from the open of two days from now. That is, take the difference of Wednesday and Tuesday’s opens per our example and store it in Monday’s row.
This gives us a data column that says, if we have a signal on this bar and buy the next open, hold for one day, what would our return be?
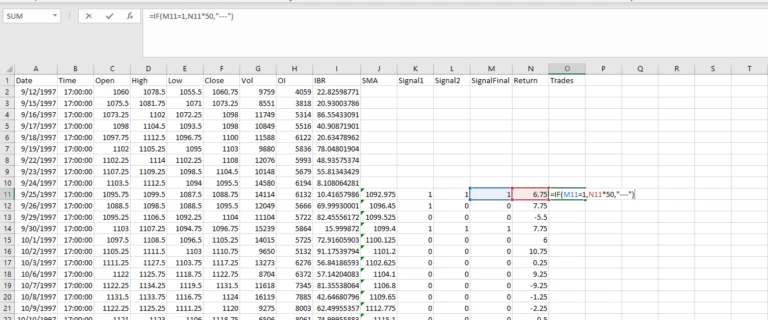
Step 8: Now let’s get our trade returns. If we have an actual signal in our ‘SignalFinal’ column from our two indicators what would our return be.
I also multiplied by 50 to represent the point value of the SP500 emini futures contract. That is, if you buy at 3346 and sell at 3347 then you’ve earned $50 per contract not $1 per contract. Each futures contract has a point value and this one’s is 50.
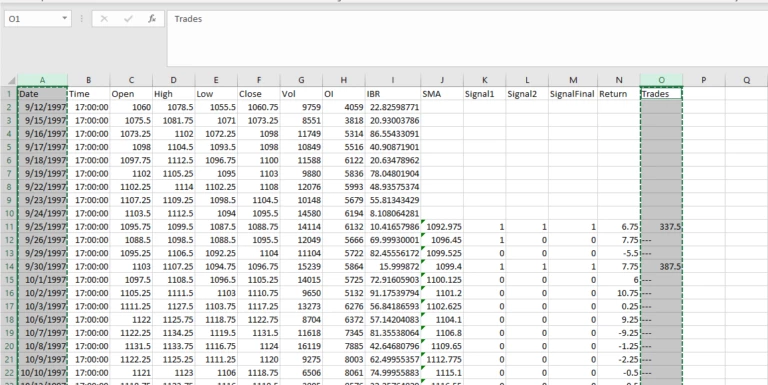
Step 9: Let’s copy our Date column and Trades column into a new tab. I clicked on the ‘A’ above ‘Date’ to highlight the entire column. I then hold ctrl and click on the ‘O’ above the ‘Trades’ column. This should highlight both columns.
Press ctrl + c to copy. Open a new tab and press ctrl + v to paste.
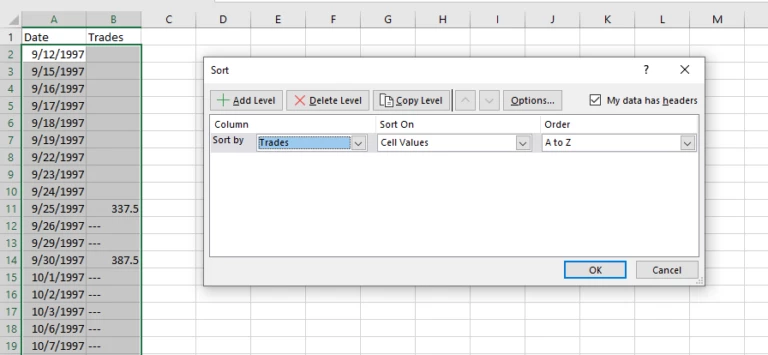
Step 10: Let’s do some house-keeping to remove the days we did not trade. We first need to sort by our Trade column and delete all days with “—” in the cell.
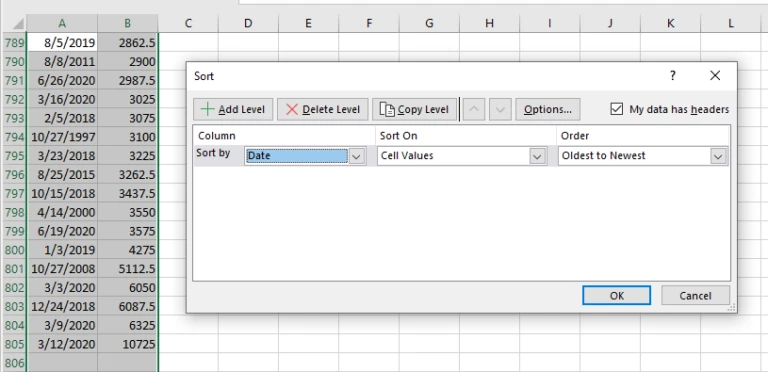
After deleting non-trade days, I then re-sort by date from oldest to newest.
To sort please highlight the columns, go to the data menu and select sort.
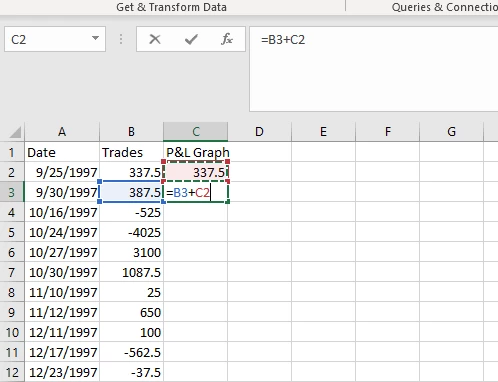
Step 11: Time to create our P&L Graph. We need to add each trade value to a rolling sum of all trade values. The simple formula is below.
Drag this formula down to calculate the equity curve’s value after each trade.
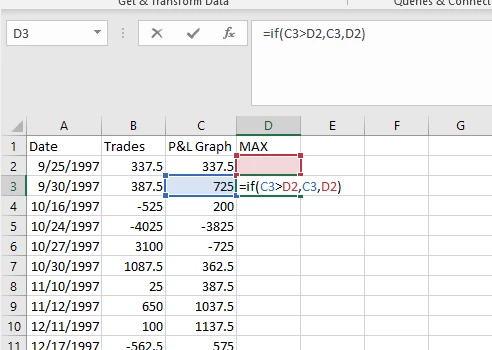
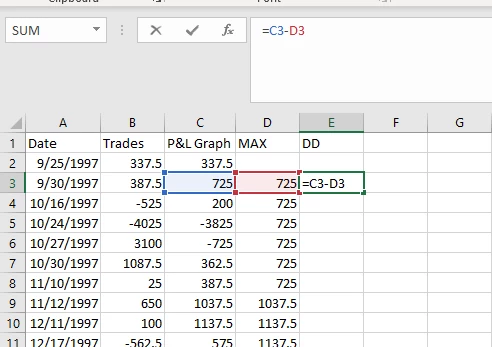
Step 12: In order to calculate the drawdown of our simple trading program we need to first calculate the high watermark or the rolling maximum amount our account would have achieved following this simple trading system.
Once we have the maximum or high watermark, we can then subtract our current P&L from the maximum to determine the current drawdown. I have added new columns for the maximum P&L (MAX) and the Drawdown (DD).
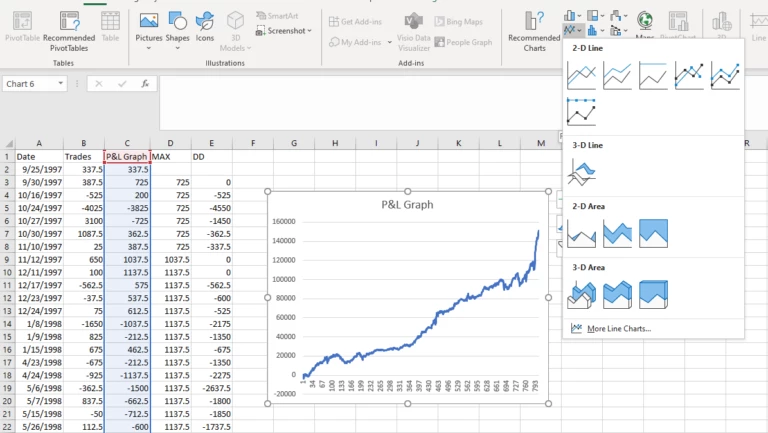
Step 13: Now we can plot our P&L Graph and Drawdown. Simply highlight the column, go to the Insert menu and select a line chart.

How to Build a Trading Algo in Python

I have done a few other blogs on how to read a text file in python and using pandas but this example will show not only how to read in data, but how to complete all the steps above in one simple python script. The goal is building trading algorithms with python – or at least the first steps.
That way you have a very rudimentary framework for testing automated trading systems and creating trading algos in python. Hopefully this serves as an intro example of how to backtest a trading program or strategy.
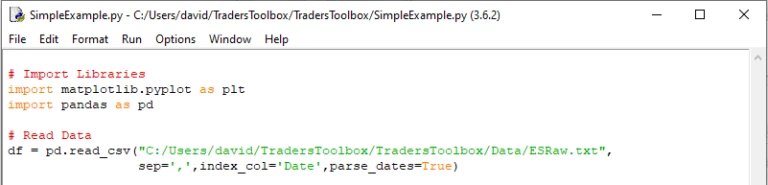
Step 1: Create a new file, import our plotting library and pandas. Matplotlib is arguably the most popular python visualization library.x
In the pandas read_csv call I have specified the file I’d like to read in, how to separate my columns, and what column should be the index of my pandas dataframe.
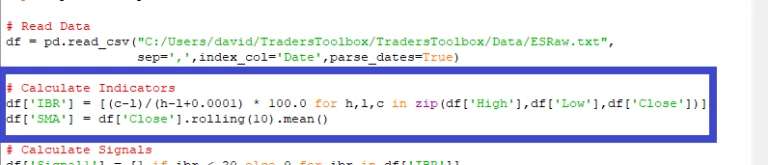
Step 2: Let’s calculate our indicators. To calculate IBR we will use list comprehension which is a very cool python trick. It allows us to do a for loop over our entire dataframe all in one line of code. The calculation is the same as excel and will create a dataframe column named IBR as we had in excel.
We will then use the pandas rolling function to create our 10 period simple moving average (mean). I have saved our moving average values in a new dataframe column named ‘SMA’ similar to excel.
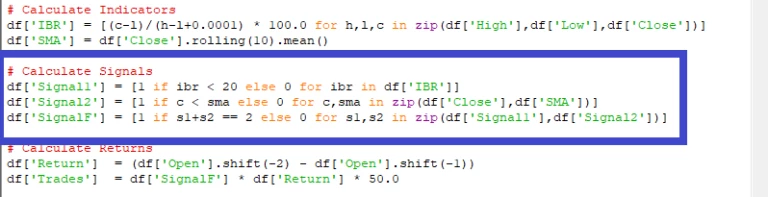
Step 3: Following similar steps as we did in excel, we can convert our indicators into actionable signals using ‘if’ logic. We will use python’s list comprehension feature which allows us to loop through our entire dataframe in a single line of code.
For instance, we will create a new dataframe column named Signal1 which will store either a 1 if IBR is less than 20 or a 0 if it is not less than 20
Step 4: Similar to excel’s footsteps let’s continue creating our python trading algo by calculating the returns and then mapping our returns and signals into actual trade results.x
First, we can use pandas built-in shift function to access tomorrow’s opening price and the opening price from two day’s from now. This is similar to how we calculated returns in excel.
To create the trade results, we need to know if there was a signal or not. We can multiply our SignalF column and our return column. If we have a signal we will have a trading return and if we do not have a signal (0) then the return will get zeroed out. I’ve also multiplied by 50 to account for the SP500 emini future contract’s point value to convert our Trades into actual dollar values for 1 contract.
Step 5: In excel we had to copy and paste our trade returns into a new tab, sort them, remove days we did not trade, etc. In Python we can simply create a new pandas dataframe, named Trades, and filter our original dataframe. We will simply return only the rows of our original dataframe where our signal was equal to 1. That is, only returning the values when we took a trade.
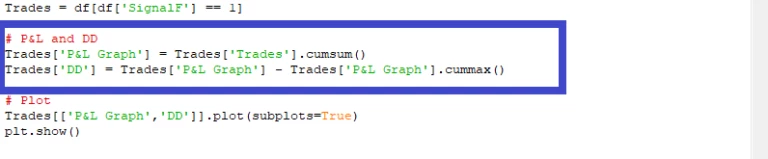
Step 6: To calculate our P&L and drawdown we can use the following two simple lines of code. Since our P&L is simply the cumulative sum of our trades we can easily just call the cumsum function on our Trades column.
In order to calculate the drawdown we can just subtract our current P&L from the rolling cumulative maximum P&L. Python and pandas has a built-in cummax function we can use which will save us from creating an additional column to store our maximum values (high watermarks). This means one less column than excel.
Step 7: Plotting in python is simple. We already imported matplotlib – our plotting library – in the first step of this python walk through. Now we can call the pandas plot function, specify that we want to use subplots, and then display our plot with the show function.x

How to Build a Trading Algo in Build Alpha

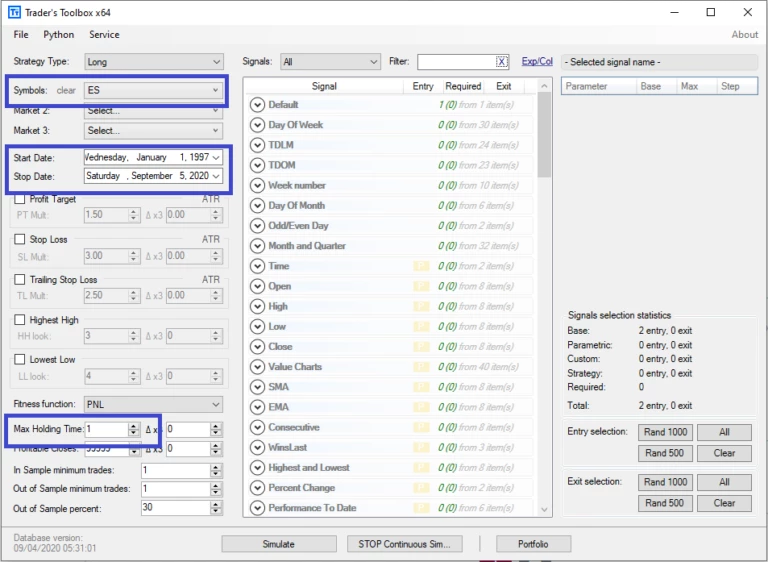
Step 1: Configure Build Alpha’s main screen. Set the symbol to ES which is the symbol for the SP500 emini futures contract.
Set the date range to start in 1997 and end near Sep 2020 to match the same data used in excel and python.
In the lower left set the max holding time to 1 bar in order to again match excel and python.
Step 2: Let’s select our signals. Type IBR into the ‘Filter’ search bar near the top. Scroll down and select the signal IBR <= 20 as an ‘Entry’.
Then type in SMA in the ‘Filter’ search bar near the top. Scroll down until you find the signal Close <= SMA(10). Select this signal as an ‘Entry’.
Then hit Simulate!
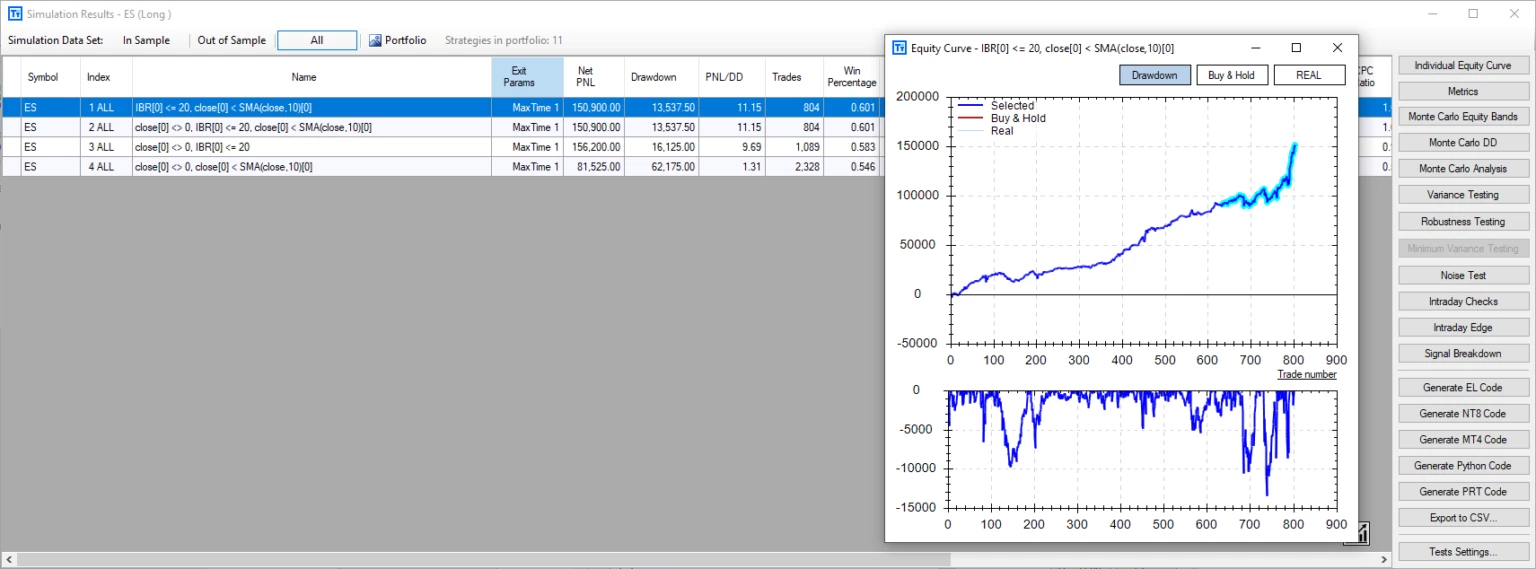
Step 3: In the Results window you will view our two rule strategy at the top (highlighted in blue). Double click on the strategy to view the P&L graph. Toggle drawdown off and on by hitting the drawdown button.

What's Next?

Some logical next questions might be how can I add a stop? How can I add more signals? How can I trade automated strategies after I’ve tested in excel or python? I encourage you to try adding on to this simple trading program idea in both excel and python. Then there can be a greater appreciation for how simple Build Alpha can make things!
Want to add a stop? Click a button. Want to add a signal? Click a button.
I am often asked how to build automated trading systems or how to create automated trading systems in excel or what is the best automated trading software and what software do professional traders use, etc. This blog post and the rest of the Build Alpha blog can answer those questions. The information is out there, the tools are out there.
Trading is not easy, but it is simple. Hunt for edges, collect them, execute them.
If you want access to the python script or the excel sheet please send me an email at david@buildalpha.com.

Other Build Alpha Python Resources

Author

David Bergstrom – the guy behind Build Alpha. I have spent a decade-plus in the professional trading world working as a market maker and quantitative strategy developer at a high frequency trading firm with a Chicago Mercantile Exchange (CME) seat, consulting for Hedge Funds, Commodity Trading Advisors (CTAs), Family Offices and Registered Investment Advisors (RIAs). I am a self-taught programmer utilizing C++, C# and python with a statistics background specializing in data science, machine learning and trading strategy development. I have been featured on Chatwithtraders.com, Bettersystemtrader.com, Desiretotrade.com, Quantocracy, Traderlife.com, Seeitmarket.com, Benzinga, TradeStation, NinjaTrader and more. Most of my experience has led me to a series of repeatable processes to find, create, test and implement algorithmic trading ideas in a robust manner. Build Alpha is the culmination of this process from start to finish. Please reach out to me directly at any time.
The Goal of Intraday Trading

A large consideration of developing trading systems should be how efficient our capital is working for us. The quicker we can realize profits, the more trades we can make thus allowing our capital to compound more quickly. Additionally, sitting in positions for long periods increases our risk to extraneous events.
On the other hand, it is typically easier to find daily or higher timeframe edges than intraday edges due to the increased noise in intraday data.

From Daily to Intraday?

Is there a way to reduce the time in a position which would increase our trade count (via number of strategies) which would then allow us to arrive at the law of large numbers more quickly and therefore allow our capital to compound more quickly?
Yep. One of the new features in Build Alpha, called “Intraday Edge”, is a tool which allows us to do exactly that. Intraday Edge allows us to dig deeper into daily trading strategies to see if we can make them more efficient by reducing their holding times into smaller intraday time windows.
Maybe we can capture most of the daily strategy’s edge during only a small portion of the typical holding time. That’s right.. turning daily strategies into intraday strategies.

Intraday Edge Trading Example

First, let’s take an original daily trading system to examine the power of this new feature. I will use a simple one rule strategy that:
This assumes about a 23 hour risk (i.e., one Globex trading session).

Intraday Improvement

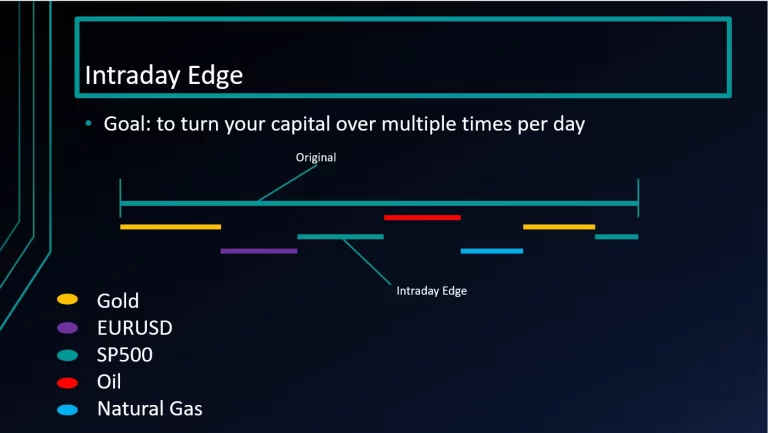
However, what if we could dig into this strategy and realize that most of the gains only come from 1 am EST to 4 am EST? We can then reduce our holding time by about 87% which now only ties up our capital for 3 hours as opposed to 23! This gives us an additional 20 hours to utilize other strategies to continue to grow our capital while still capturing a large portion of the original daily strategy’s edge.
Imagine we only had enough capital for one strategy. This Intraday Edge feature can now make our capital work much harder by finding intraday edge strategies for multiple markets/times of the day. Tying up capital for 23 hours in one daily strategy vs. trading 7 different intraday edge strategies with the same capital.
*Original strategy can be reduced by Intraday Edge which allows other intraday strategies to be traded with the same capital that was orignially tied up by the daily strategy*
In the end, it makes our once daily system much more efficient. Check out the performance metrics of the original daily system compared to the new “Intraday Edge” version.
*Daily Strategy*
*Intraday Edge*
In the end, it makes our once daily system much more efficient. Check out the performance metrics of the original daily system compared to the new “Intraday Edge” version.

Steps in Build Alpha

So how can this be accomplished in Build Alpha? It is simple.
Build Alpha will then search all possible holding periods within the original strategy’s trading duration to see if there is a more efficient version with reduced holding times. You can include the original strategy’s exit criteria such as stops, etc. or choose to exclude them. Flexibility to test everything is always key in Build Alpha.

Additional Uses of Intraday Edge Feature

Intraday Edge can even be used on different markets at the same time. For example, imagine an original system built on Gold daily bars but then we search for an intraday edge version that trades oil but only during this specific 2 hour window while the original Gold System has an active signal.
This Intraday Edge feature essentially allows us to search for intraday and multi-timeframe strategies in a new way. In this above Gold and Oil example we have a multi-timeframe AND intermarket strategy created from a simple Gold daily strategy.
You can still search for multi-timeframe and intraday strategies in the original/traditional way. That is, just searching the intraday data from the start. However, it is often faster and easier to find daily strategies then work them into intraday ones. At least now with Build Alpha you have the option to search both ways. Something not possible elsewhere.

Automating Intraday Edge Trading Strategies

And of course, all of the adjustments from the Intraday Edge feature are then applied to the code generators so you can automate these Intraday Edge systems with one click as with everything.
As always, I will keep attempting to add flexibility and ways to dig deeper so we can have the best trading strategies possible. Leave no stone unturned and test everything!
Thanks for reading,

Author

David Bergstrom – the guy behind Build Alpha. I have spent a decade-plus in the professional trading world working as a market maker and quantitative strategy developer at a high frequency trading firm with a Chicago Mercantile Exchange (CME) seat, consulting for Hedge Funds, Commodity Trading Advisors (CTAs), Family Offices and Registered Investment Advisors (RIAs). I am a self-taught programmer utilizing C++, C# and python with a statistics background specializing in data science, machine learning and trading strategy development. I have been featured on Chatwithtraders.com, Bettersystemtrader.com, Desiretotrade.com, Quantocracy, Traderlife.com, Seeitmarket.com, Benzinga, TradeStation, NinjaTrader and more. Most of my experience has led me to a series of repeatable processes to find, create, test and implement algorithmic trading ideas in a robust manner. Build Alpha is the culmination of this process from start to finish. Please reach out to me directly at any time.
In short, this is a new feature that allows us to optimize strategies across noise adjusted data series as opposed to the traditional method of optimization which only optimizes across the single historical price series. Here is a reminder on the Noise Test.
The problem we face is the historical data is merely only one possible path of what *could* have happened. We need to prepare ourselves for the probable future not the certain past. In order to do this, we can generate synthetic price series that have altered amounts of noise/volatility than the actual historical data. This provides us with a rough sample of some alternate realities and potentially what can happen going forward. This is the exact type of data that can help us build more robust strategies that can succeed across whatever the market throws at us – which is our end goal in all of this, right?

Noise Test Trading Strategy Example

Let’s look at a Noise Test Parameter Optimization (NTO) case study to show exactly how it works…
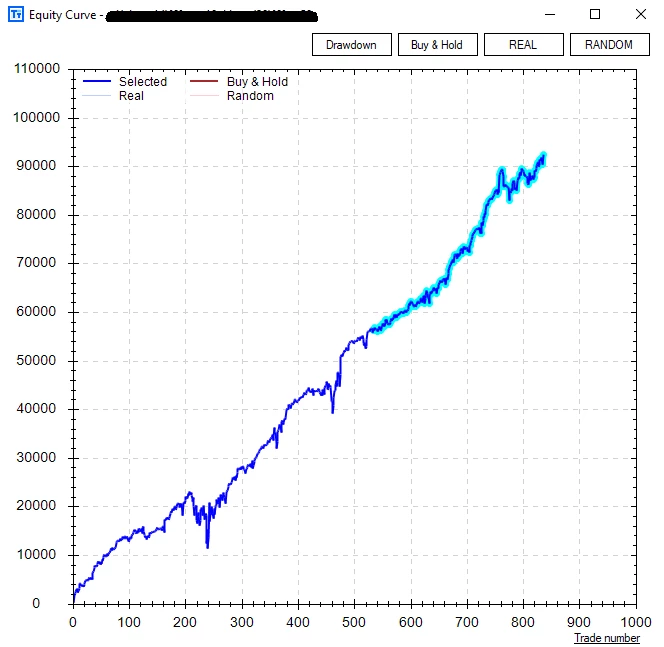
I have built a strategy from 2004 to 2016 that does quite well. The strategy’s performance over this period is shown below…
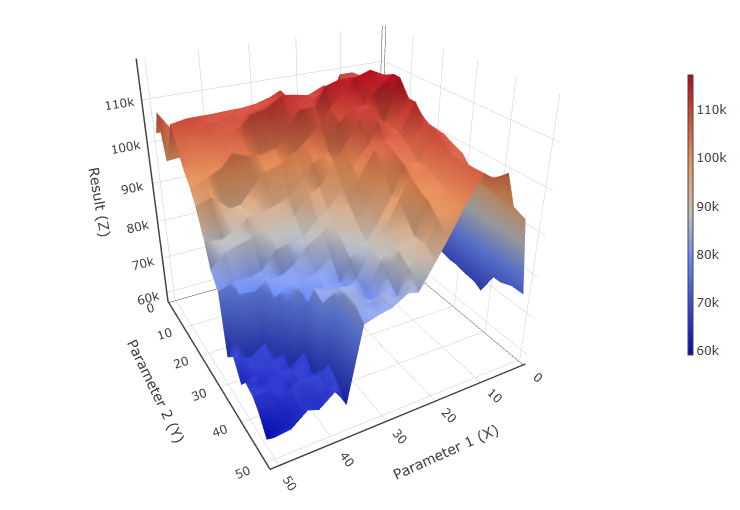
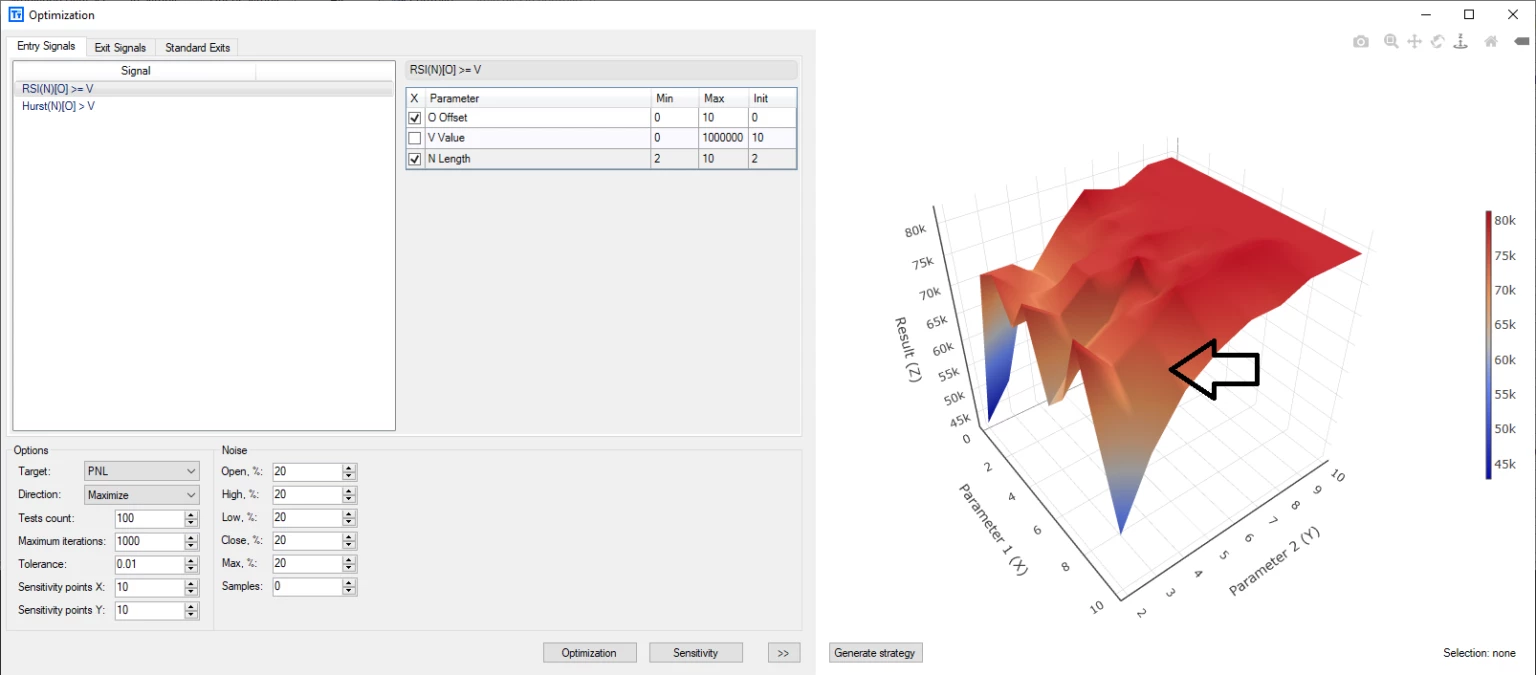
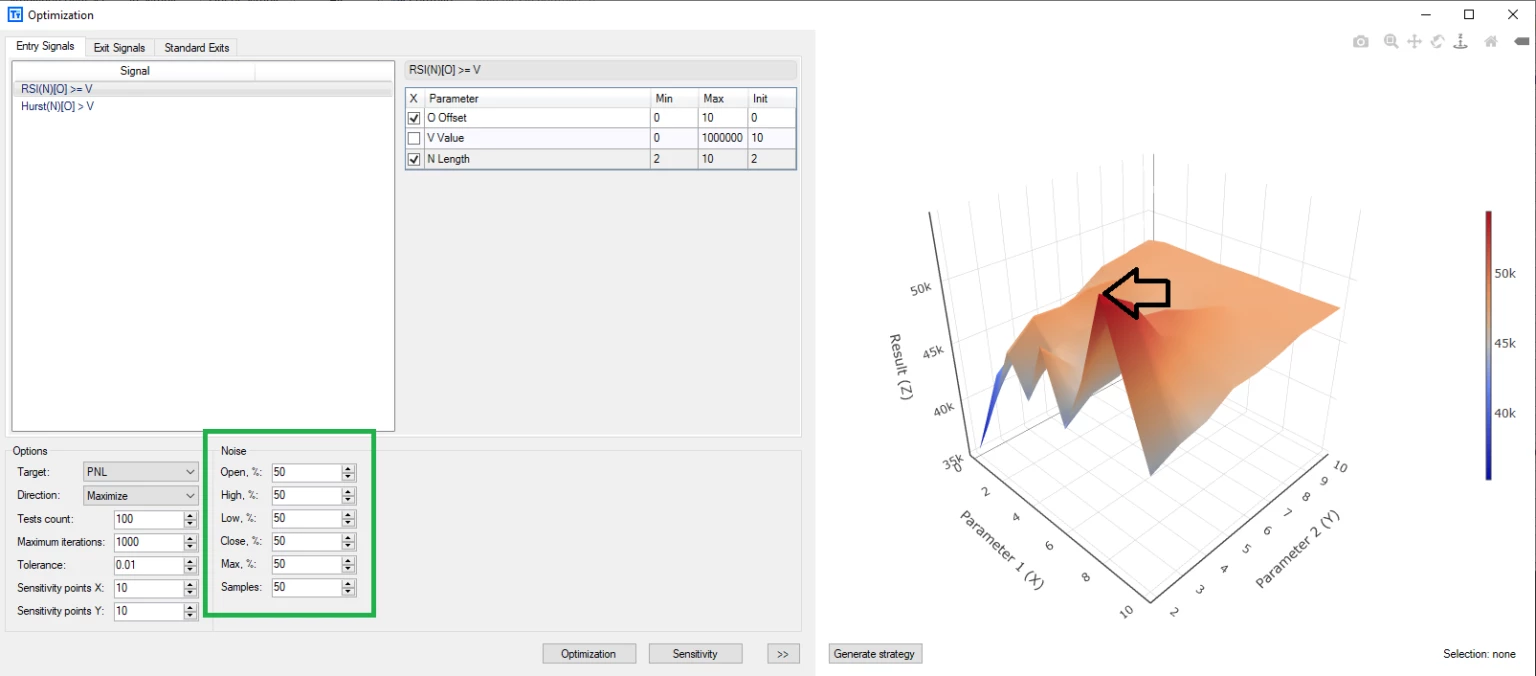
Now, if we right click on the strategy and select optimize, we can generate a sensitivity graph that shows how our strategy performs as we alter some parameters. This is done on the original historical price data with no noise adjusted data samples added (yet).  We simply retrade different variations of parameter settings on the single historical price data and plot the respective performances. This is how most platforms allow you to optimize parameters and I want to show how misleading it can be to traders. The rule I’ve optimized had original parameter values of X = 9 and Y = 4 (black arrow). The sensitivity graph is shown below. Each plot consists of three points: parameter 1, parameter 2 and the resulting profit.
We can see the original parameters are near a “sensitive area” on the surface where performance degrades in the surrounding areas. Performance drops pretty hard near our original strategy’s parameters which means slight alterations to the future price data’s characteristics can degrade our strategy’s performance quite a bit. Not what we want at all and, as we all know, there will be alterations to future price’s characteristics! How many times has a backtest not matched live results? Perhaps more robust parameter selection can help…

Parameter Selection

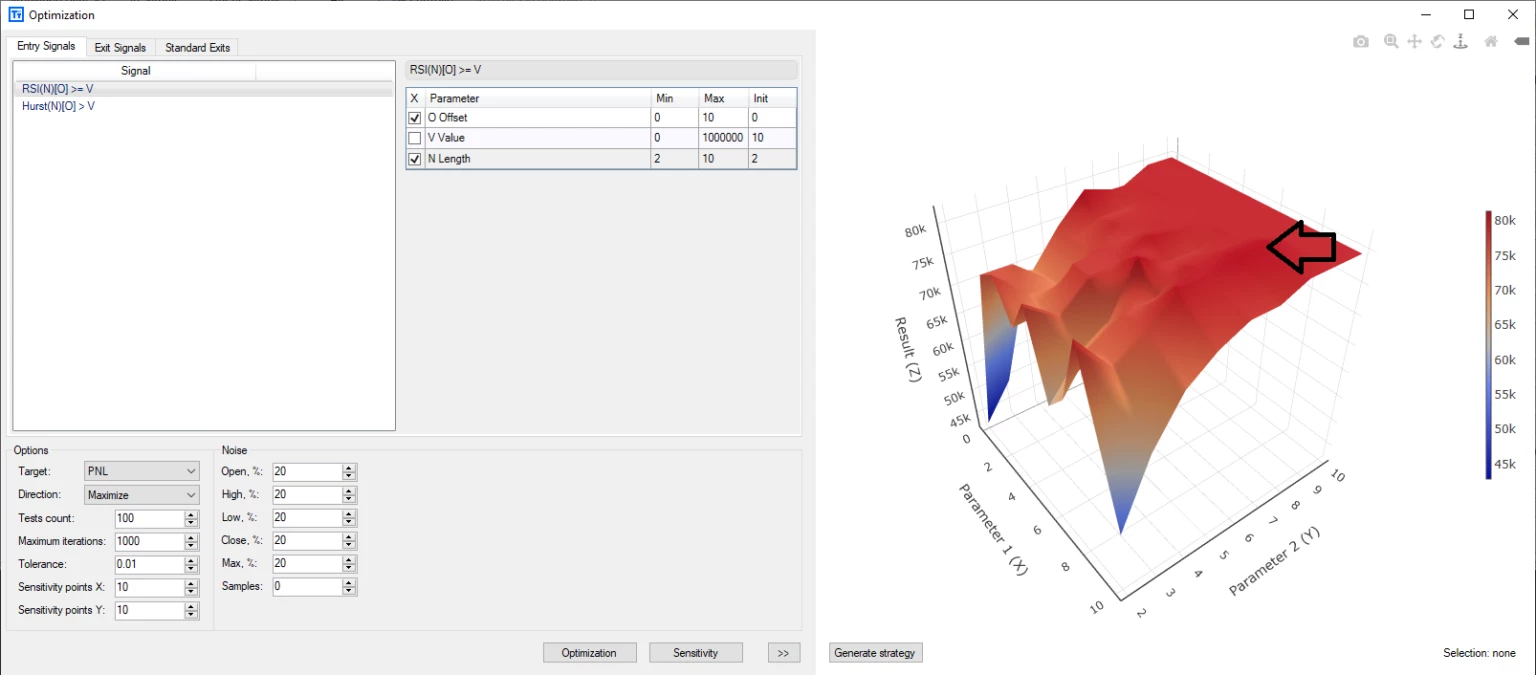
The more robust selection using the typical simple optimization method on the historical data shows we should probably pick a parameter more near X = 8 and Y = 8 (pictured arrow below). This is the traditional method taught in textbooks, trading blogs, etc. We optimize on the single historical data then find a flat/non-peaked area close to our original parameters and use those new parameters.

NTO Parameter Selection

However, if we run Build Alpha’s Noise Test Optimization with up to 50% noise alterations and 50 data samples (green box below), we see a much different picture. What this does is, instead of optimizing on one historical path we now optimize across the one historical path AND 50 noise altered data series. The sensitivity graph shows a much different picture when optimized across the 51 data series. We are less concerned with the total profit and loss but rather the shape of the surface…
The Noise Test Optimization (NTO) shows we should actually pick values of X = 8 and Y = 2 (arrow above). This area actually outperforms the ‘robust’ area from the traditional simple one data set optimization that most other platforms and textbooks show. In other words, I am comfortable picking a peaked area of the surface from the NTO results because the peak is true across noise adjusted values and not just a single price series. Secondly, if we fall off this peak then we are still at (or near) the highest level relative to the rest of the surface.

Forward Results

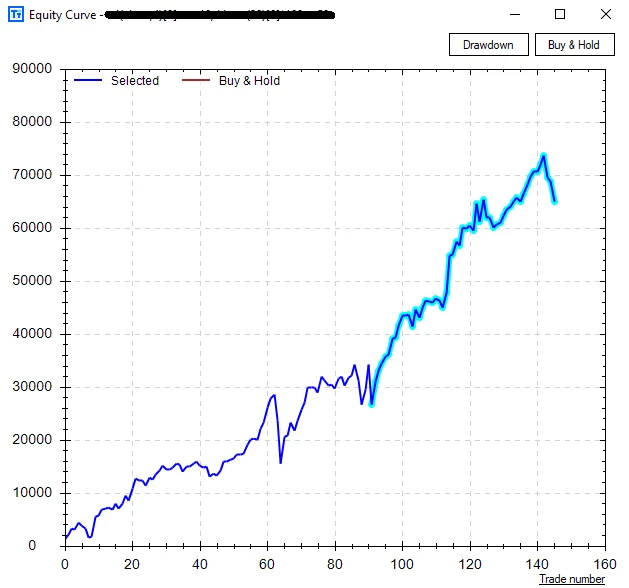
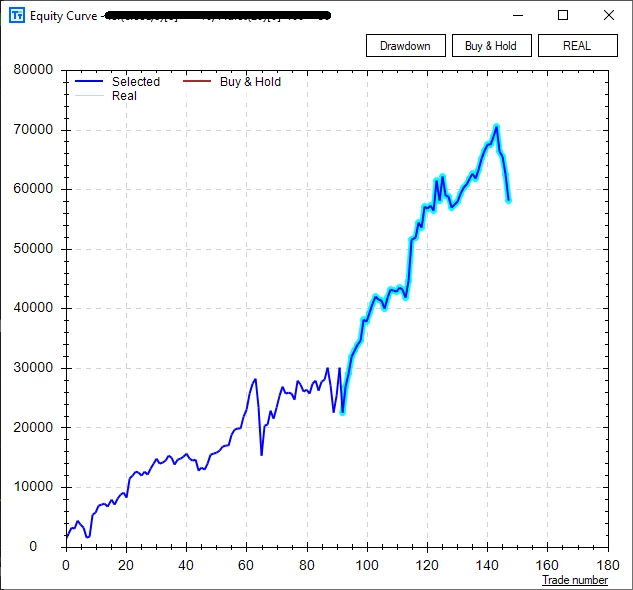
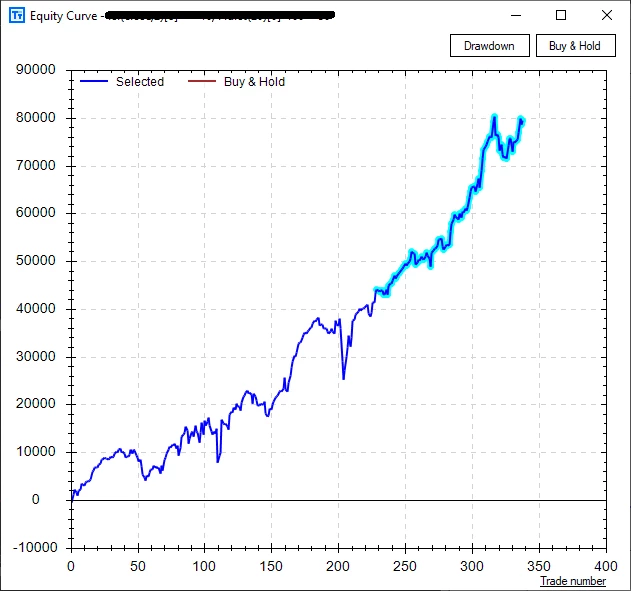
Looking at how all three of these parameter selections performed from 2016-2020 can be quite telling…
*Original Parameters 2016-2020*
*Textbook Parameter Selection 2016-2020*
*NTO Parameters 2016-2020*
The Noise Test Optimization (NTO) returned about $20,000 more profit per contract than the other two methods in this hypothetical case study or about 33% more profit over the same 2016-2020 period. These small adjustments to commonly misused tests can really make a large difference when spread across a portfolio of strategies. It is time to stop using outdated tools. I am not saying each strategy will show NTO results like this, but failing to check is a compounding mistake few of us can afford to make.
Build Alpha also possesses the ability to optimize parameters across a basket of symbols (and their noise adjusted data as well). For example, build a strategy for SPY but optimize it across SPY, QQQ, IWM and DIA.
As always, thanks for reading

Author

David Bergstrom – the guy behind Build Alpha. I have spent a decade-plus in the professional trading world working as a market maker and quantitative strategy developer at a high frequency trading firm with a Chicago Mercantile Exchange (CME) seat, consulting for Hedge Funds, Commodity Trading Advisors (CTAs), Family Offices and Registered Investment Advisors (RIAs). I am a self-taught programmer utilizing C++, C# and python with a statistics background specializing in data science, machine learning and trading strategy development. I have been featured on Chatwithtraders.com, Bettersystemtrader.com, Desiretotrade.com, Quantocracy, Traderlife.com, Seeitmarket.com, Benzinga, TradeStation, NinjaTrader and more. Most of my experience has led me to a series of repeatable processes to find, create, test and implement algorithmic trading ideas in a robust manner. Build Alpha is the culmination of this process from start to finish. Please reach out to me directly at any time.
I am back! I want to share another Build Alpha success story with you guys for a few reasons. First, I have been very quiet on social media, etc. lately and that is because I do not need to promote Build Alpha every day (although I probably should). I haven’t tweeted in month(s), but I have maintained my typical support, however. Anyways, think twice about traders that push their service, product, software, etc. every single day – it means they rely on it. Secondly, this Build Alpha user is the EXACT reason why I started on this journey of making Build Alpha publically available. His story also echoes my own – which is why I am so fascinated by it and could not resist sharing it with everyone.
First, let me reiterate my main goal with Build Alpha, the one written on the homepage of the site since day one: “Bridge the gap between the programming world, the quantitative trading world, and the money manager/trader who seeks to evolve with the times.”
In other words, can I take someone with no programming/trading experience and help turn them into a successful systematic trader? That is what I set out to do. I know the depths of the trader struggle and I want to pull as many traders as I can from that pain.. because man, do I still remember it like it was yesterday!
I do not wish to teach programming or wish to give you some PhD in statistics/finance, etc. My main goal was to create a tool to bring a trader who is completely unexposed (or partially unexposed) to algorithmic trading the ability to create their own portfolio of strategies, understand how pros think about risk, AND automate these strategies all without ANY programming. That is, take someone from no programming experience to algo trading profits without any programming.
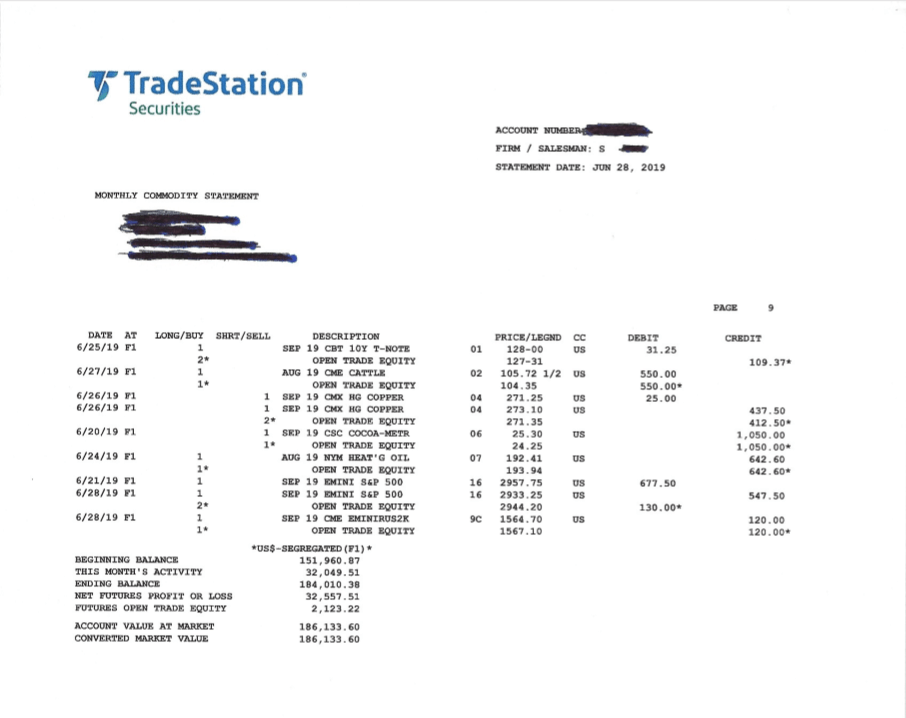
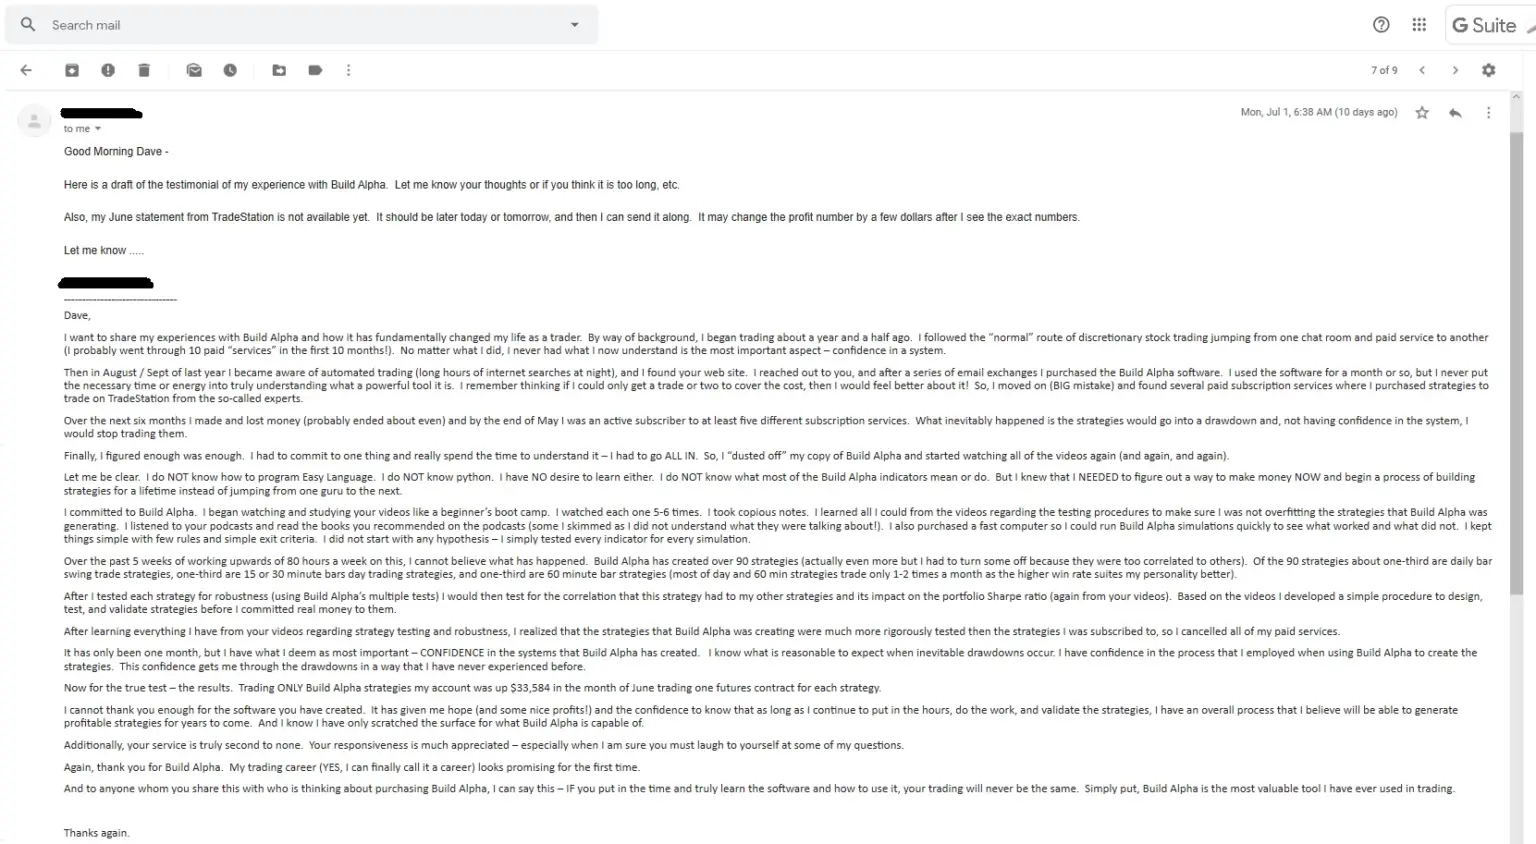
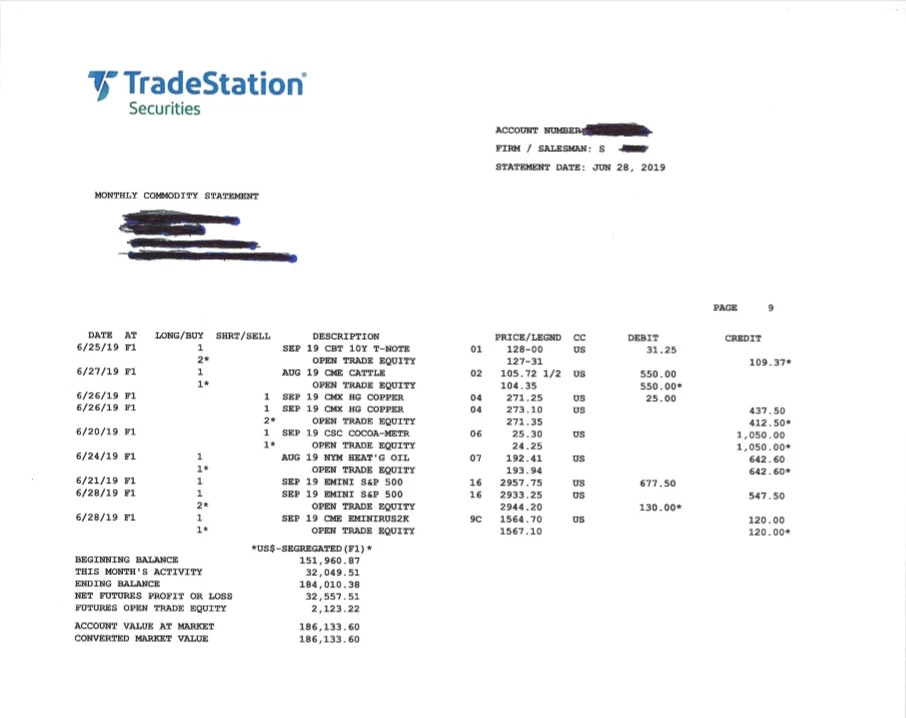
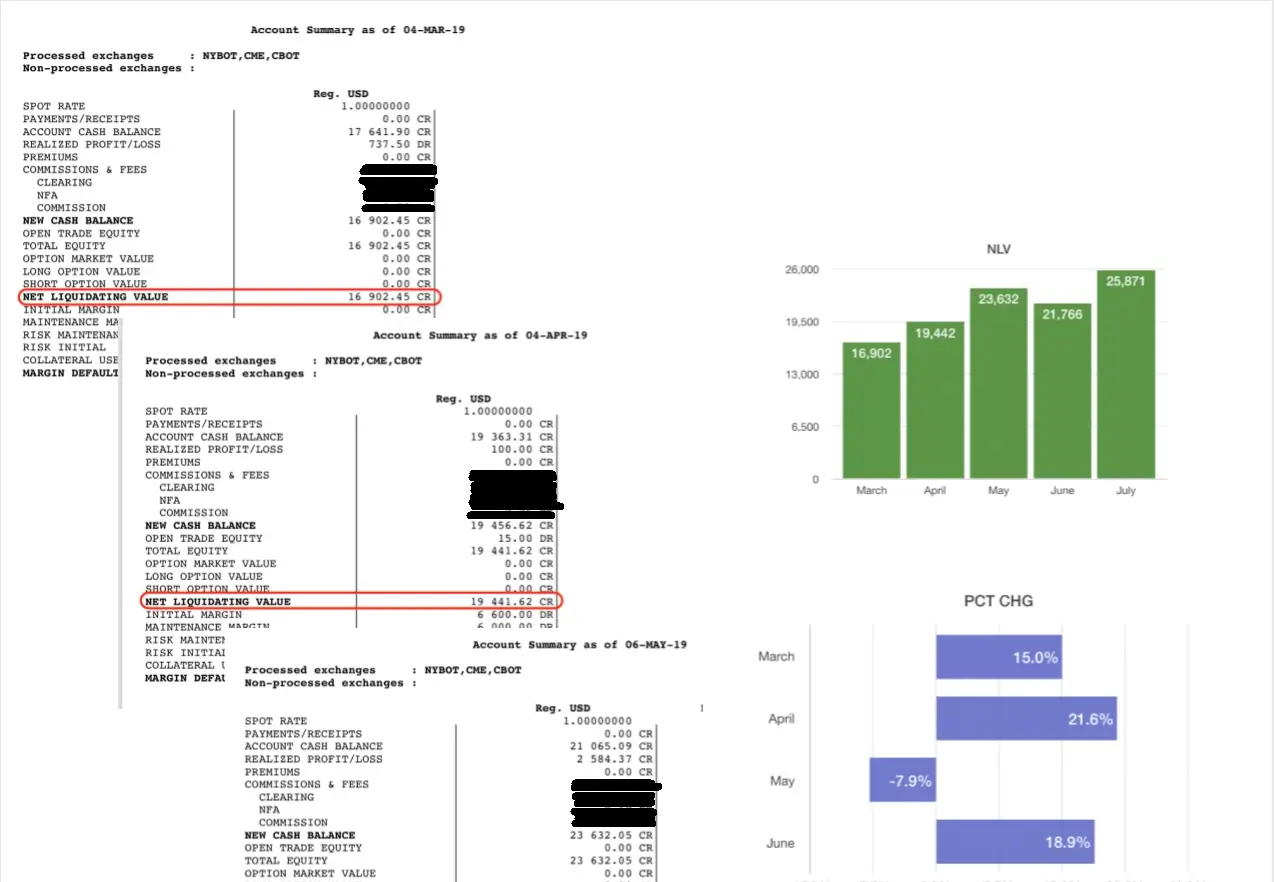
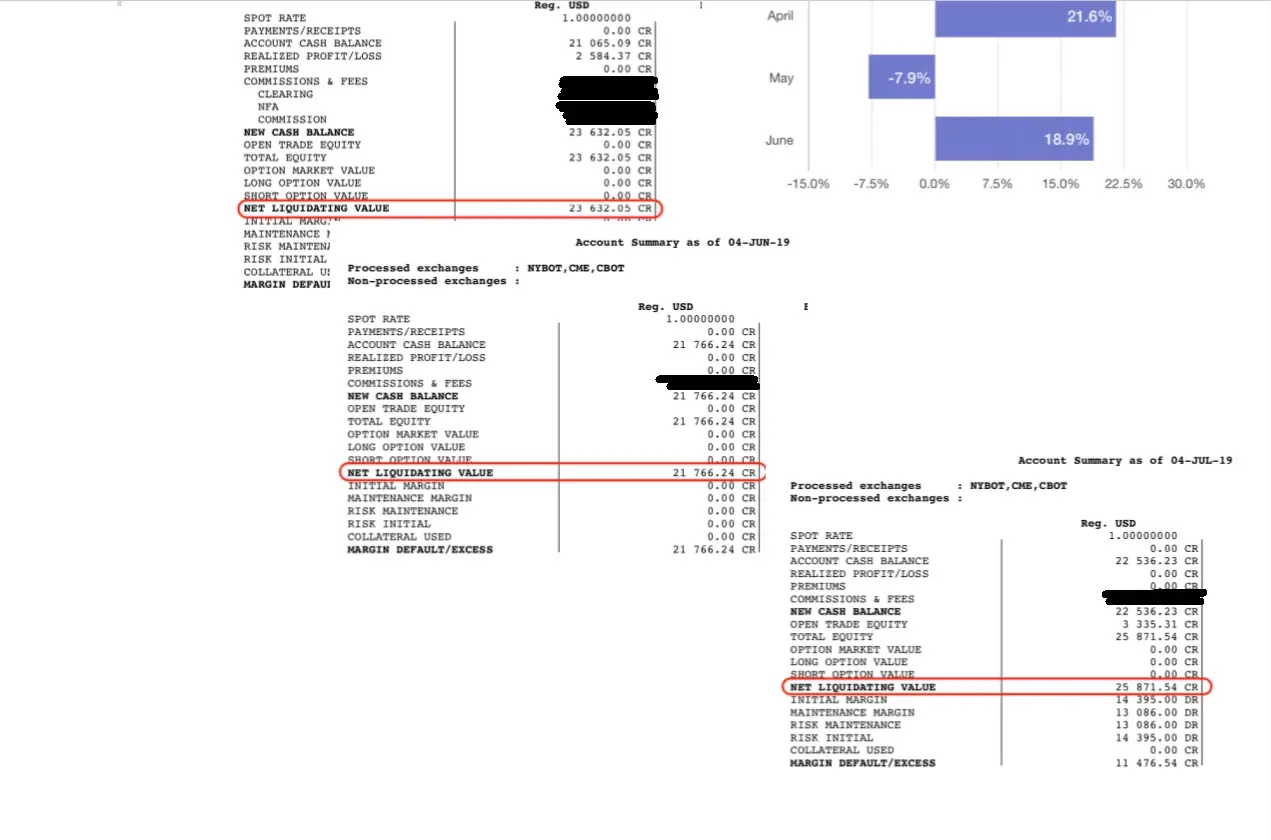
The trader who I am talking about wishes to remain nameless (for now) and I will refer to him as TraderX. His email to me and account statement are below.
Testimonial Disclosure: Testimonials appearing on this website may not be representative of other clients or customers and is not a guarantee of future performance or success.
*click to zoom*
His story is eloquently explained in his email as only a trader experiencing the full journey could. I’ve only summarized his highlights for convenience, but his words are better.
Highlights
TraderX is a great case study because he was literally the struggling/learning trader I can relate to from my own experiences and watching/talking to him now with his evolved understanding of trading is truly incredible and cannot wish this success to a more deserving trader. The answer is simple: admit where you are, agree to put the work in, watch the videos, do the work, be patient. This is a general recipe for success in life – TraderX only got into trading after selling his own business. Some people just get it… others need to hear it first; that is why I do these posts. The answers are certainly there and exist!
I normally hate publishing these testimonials but am glad to have explained why I do. The results are simply the byproduct of great workflow/process learned through hardwork, Build Alpha training videos and experimenting. TraderX is not alone in the BA community in this regard. Here is another user’s statements over the past few months where you can see successful trading. He is taking his time, abiding by the numbers/expectations he’s created and ultimately growing himself and his account. Remarkable.
*click to zoom – had to cut his original image into two images so some overlap between*
To learn more, please contact me at david@buildalpha.com. Reminder: Build Alpha comes with 50+ training videos where I explain system trading principles, system trading basic, and of course the details of how to maximize the Build Alpha software.
Thanks for reading,
David
Testimonial Disclosure:  Testimonials appearing on this website may not be representative of other clients or customers and is not a guarantee of future performance or success. To view full risk disclosures please visit Disclaimers – Build Alpha

Author

David Bergstrom – the guy behind Build Alpha. I have spent a decade-plus in the professional trading world working as a market maker and quantitative strategy developer at a high frequency trading firm with a Chicago Mercantile Exchange (CME) seat, consulting for Hedge Funds, Commodity Trading Advisors (CTAs), Family Offices and Registered Investment Advisors (RIAs). I am a self-taught programmer utilizing C++, C# and python with a statistics background specializing in data science, machine learning and trading strategy development. I have been featured on Chatwithtraders.com, Bettersystemtrader.com, Desiretotrade.com, Quantocracy, Traderlife.com, Seeitmarket.com, Benzinga, TradeStation, NinjaTrader and more. Most of my experience has led me to a series of repeatable processes to find, create, test and implement algorithmic trading ideas in a robust manner. Build Alpha is the culmination of this process from start to finish. Please reach out to me directly at any time.
I wanted to give this latest version of BuildAlpha its own blog post as there are a few features that deserve a more thorough explanation to fully understand their power. I will highlight three of these new features below.

1. Testing Across Markets

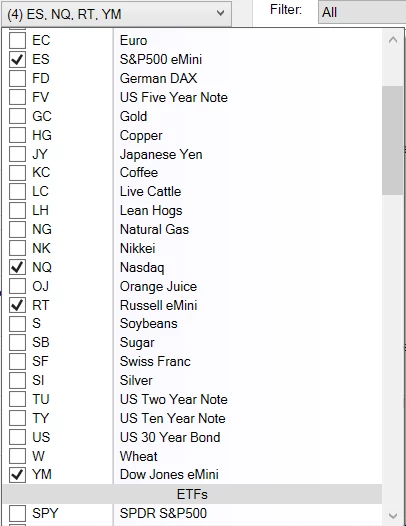
The latest version allows the trader/money manager to develop strategies across a basket of instruments as opposed to just one symbol. For example, one can select Gold, Oil, SP500 and 30 Year Bonds (as well as thousands of signals at once) and the software will find the best strategies based on the combined performance across the selected instruments.

You can also build trading strategies that are trained on various timeframes at once. For example, a basket can consist of 30 minute data, 240 minute data and daily data and the software will find the strategies that work best across all these timeframes.

I first mentioned this technique of testing across markets to reduce the chances of curve-fitting in this blog here: https://buildalpha.com/3-simple-ways-to-reduce-the-risk-of-curve-fitting/

Testing across markets (and/or timeframes) is a great way to find robust strategies that generalize well and help to combat over-fitting.

If you don’t believe me, take Jaffray Woodriff’s word for it. Woodriff, the founder of $3 Billion Quantitative Investment Management, was recently in the news for his $120M (yes, million) donation to the University of Virginia’s data department.

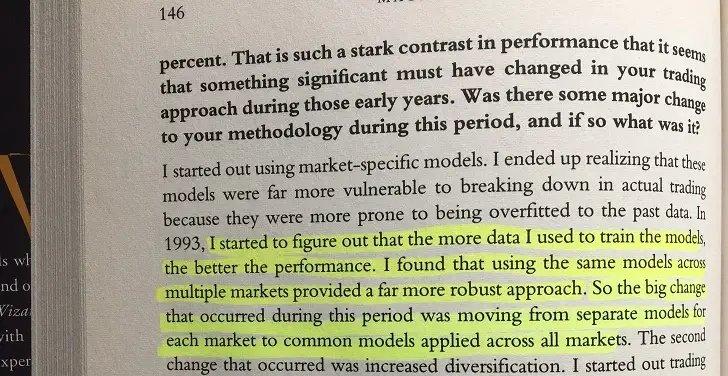
In the book Hedge Fund Market Wizards, Woodriff was asked what changed from his early years when he was slightly down for two straight years to when he made over 80% in just the first six months of the following year. Here is his response straight from the book

“I started to figure out that the more data I used to train the models, the better the performance. I found that using the same models across multiple markets provided a far more robust approach. So the big change that occurred during this period was moving from separate models for each market to common models applied across all markets.” Pg. 146
Furthermore, if (when) the market changes then strategies built on multiple (and even better, diverse) markets should stand a better chance of surviving as they’ve been built across different data sets.

Build Alpha now makes it incredibly simple to build and test ideas and strategies across multiple markets at once. Just select one or as many markets as you prefer from the drop down menu and Build Alpha will return the results of the strongest strategies built across the entire basket. The ability to analyze the aggregated results as a basket as well as analyze the individual components is extremely simple.

The top row is the aggregate performance of the entire basket denoted by the symbol ‘BSK’. If you click the top left arrow it will drop down the basket’s components with their respective indiviudal performance.
Note: I am not saying that single market models do not work! They most certainly do, and there are certainly players that only participate in specific markets thus creating idiosyncratic patterns and opportunities. Of course the BuildAlpha trader can still search for single market models in BA as well. Flexibility is always key!

2. Trigger Signals

A trigger signal is the combination of two rules or signals occurring within a specified time window. We assume the main signal is occurring right now and then require that the second signal – the trigger signal – had to occur at least once in the last N bars for the full combined signal to be valid.
A simple example is to consider these two signals
  1. Close crosses above the 20 period SMA (main)
  2. Close is below the lower Bollinger Band at any time in the last 5 bars (trigger)
If we cross above the 20 SMA today and at any point in the last 5 bars we also closed below the lower Bollinger Band then we have an active signal.
Adding a ‘trigger’ to a signal can greatly improve the edge of the main signal. I ran a simple test using the above Trigger Signal on a basket of securities (ES,NQ,US,SPY,QQQ,TLT) and viewed the combined E-Ratio. The original main signal (with no trigger signal) is seemingly random with an aggregated E-Ratio of only 1.02. However, adding the trigger signal jumped the E-Ratio to 1.39 – a 36.27% improvement.
Additionally, the E-Ratio for the main signal when just considering the 30 Year Bond Futures (symbol US) improved about 100% from 1.05 to 1.92 with the addition of the trigger signal.
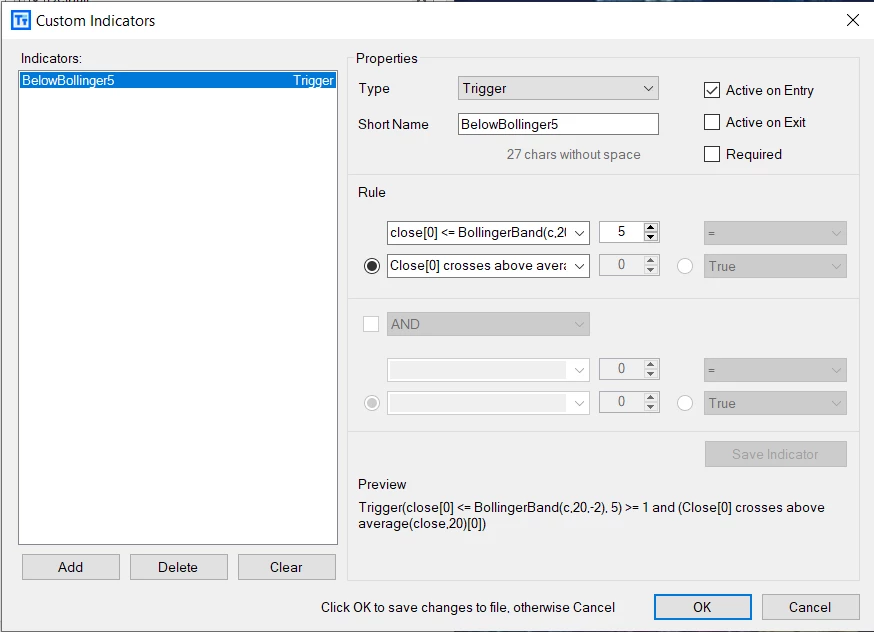
To create trigger signals simply go to File -> Custom Indicators and set type to Trigger. Here is an example of the above Trigger Signal:
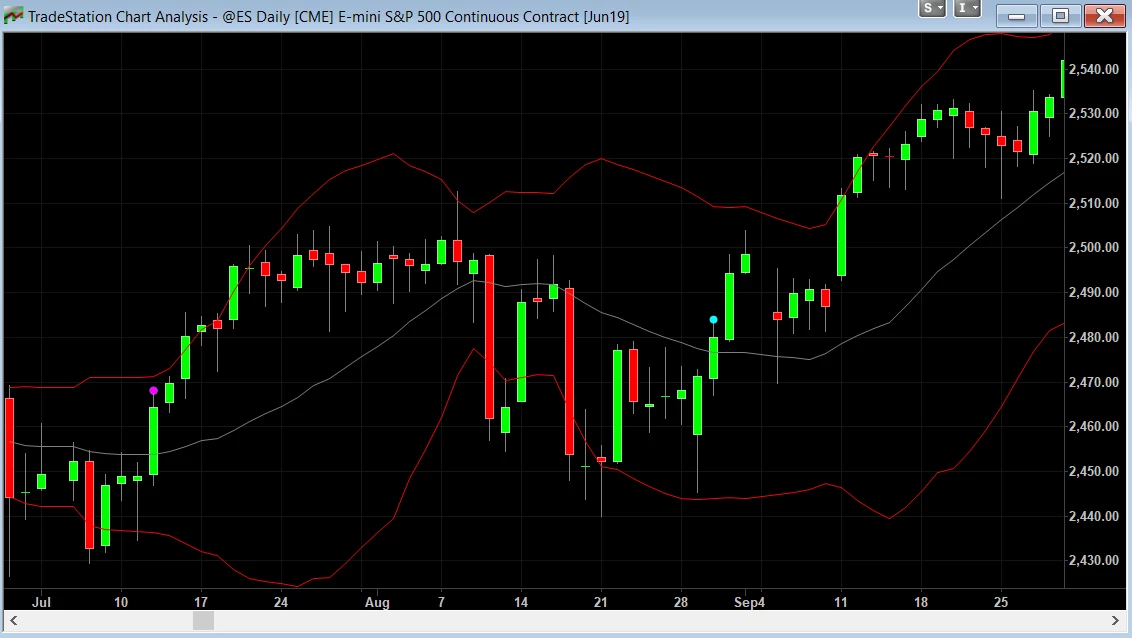
And here is a visual (pink dot is a true signal with trigger and blue dot is a true signal without trigger)
More on these in future upgrades..

3. Signal Breakdown

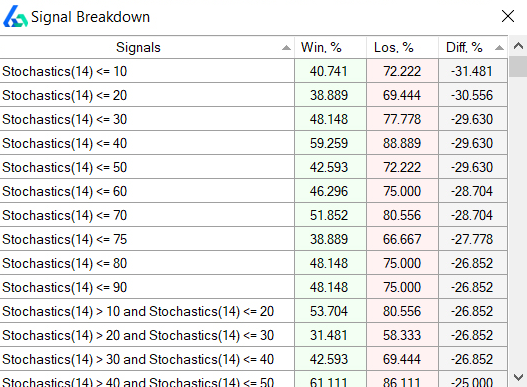
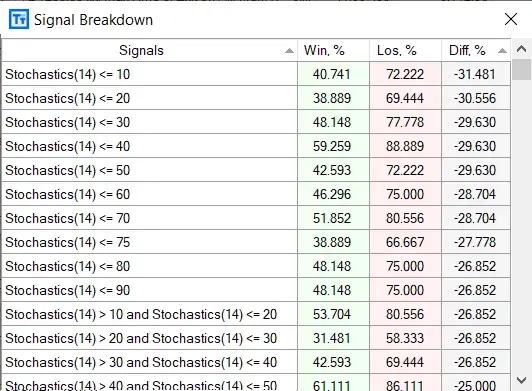
The final new feature I want to discuss allows us to view EVERY signal Build Alpha has (currently 5000+) and the likelihood it occurs on our winning trades as well as the likelihood it occurs on our losing trades even if it is not included in our original strategy’s rules. Why is this helpful? Well this can give us insights into what signals, rules or filters we can add (or exclude) to improve a strategy.

For example, if you knew that a specific signal occurred on 75.32% of your winning trades and on only 14.75% of your losing trades would you want to include this rule in your strategy to see if it improves results? Of course.
Additionally, if you knew that a specific signal occurred on only 18.37% of your winning trades but on 84.69% of your losing trades would this not be a rule you’d want to exclude from your strategy – in other words, avoid trading when this rule is true as it appears only true on losing trades!
The Signal Breakdown can be a powerful tool to help improve, tweak and understand strategies. However, caution is advised to still follow proper testing procedures such as in and out of sample testing, etc. There are other posts regarding this matter.
Why doesn’t Build Alpha find these rules initially? It does, but the user also has the ability to limit the software to generate the best strategies only using a user specified maximum number of rules. If the user wants to later add an additional rule then using the Signal Breakdown can lend insights into which additional rule(s) to add.
As always, thanks for reading and your support. It means a lot.
Thanks,

Author

David Bergstrom – the guy behind Build Alpha. I have spent a decade-plus in the professional trading world working as a market maker and quantitative strategy developer at a high frequency trading firm with a Chicago Mercantile Exchange (CME) seat, consulting for Hedge Funds, Commodity Trading Advisors (CTAs), Family Offices and Registered Investment Advisors (RIAs). I am a self-taught programmer utilizing C++, C# and python with a statistics background specializing in data science, machine learning and trading strategy development. I have been featured on Chatwithtraders.com, Bettersystemtrader.com, Desiretotrade.com, Quantocracy, Traderlife.com, Seeitmarket.com, Benzinga, TradeStation, NinjaTrader and more. Most of my experience has led me to a series of repeatable processes to find, create, test and implement algorithmic trading ideas in a robust manner. Build Alpha is the culmination of this process from start to finish. Please reach out to me directly at any time.

What is an Ensemble Method?

“In statistics and machine learning, ensemble methods use multiple learning algorithms (trading strategies in our case) to obtain better predictive performance than could be obtained from any of the constituent (individual strategies) learning algorithms.”
A simpler example would be to consider it as a voting system. Imagine 3 SPY strategies. In theory (and every individual case needs tested), if one strategy says long and the other two say flat (or short) then long is not a very confident position. On the other hand, if two or all three strategies say long then it is a more confident long entry.
It is also important to point out or imagine the market as a living breathing organism that is constantly evolving and dynamic in nature. So imagine having a strategy on Oil, Gold, Bonds and Stocks. Now you can get a better picture of what is happening in individual markets and how their combination or interaction can help predict what to do next in a stock index or the US dollar strategy, for example.
This is slightly different than intermarket strategies because intermarket strategies simply include ‘signals’ from secondary markets. Ensemble strategies are actually using the strategies themselves which undoubtedly carries more information than just the signals themselves.

Ensemble Strategies in the real-world and Finance

The first example, is about the Netflix challenge where Netflix offered a million dollar prize for the “best suggested movies to watch” algorithm. Jaffray Woodriff, founder and CEO of Quantitative Investment Management ($3B in AUM), competed in the contest and took 3rd! Woodriff is a big proponent of ensemble methods and mentions such in his Hedge Fund Market Wizards chapter of Jack Schwager’s great book. The team that actually won the contest was in a close race with the second-place team and wound up running away with the first-place prize by using an ensemble method applied to the other top 30 competitors’ models. I am trying to convey financially incentivized practicality here; the story comes from Ensemble Methods in Data Mining by Giovanni Seni and John Elder with a foreword by Jaffray Woodriff.

Ensemble Strategies and Trading

The two main things that plague trading strategies are
  1. Underfitting (bias)
  2. Overfitting (variance)
In the latest book sweeping the Quant world: Advances in Financial Machine Learning Ensemble Methods have their own dedicated chapter! In this chapter, the author Marcos Lopez de Prado (head of AQR’s machine learning division and formerly founded and led Guggenheim’s Quantitative Investment Strategies that had over $13B in assets) states,
“An ensemble method is a method that combines a set of [weak] learners… in order to create a [stronger] learner that performs better than any of the individual ones. Ensemble methods help reduce bias AND/OR variance”.
So ensemble methods can help reduce overfitting? That sounds desirable for every system trader I know!

Quick Ensemble Tips

  • Ensemble strategies will be better the more diverse the individual strategies. For example, use one strategy that looks at volume, one that looks at price action, and one that looks at spreads or intermarket signals.
  • Do not try and ensemble very poor individual strategies and expect miracle improvements. Simple ensemble methods such as bagging, cannot improve the accuracy of such poor systems. So, you still have to put effort in designing the individual strategies! Ensembling is not a shortcut that can turn dirt into gold; however, it can polish up some things very nicely.
  • Finally, ensembling (with bagging) is more likely to be successful in reducing variance (overfitting) than reducing bias (underfitting). This attacks the BIGGEST problem we have as system traders and developers.

Ensemble Strategies and Trading in Build Alpha

We can now select individual strategies that we want to use in the overall simulation. This means we can build strategies that only take a position when another strategy has an existing position. This is a great way to create hedging strategies (more on this in a later post/video).
The above ‘signal’ (if used) would only enter a trade when our strategy ‘SPY Strategy3 Trend’ has an existing position. This is a simple way to build hedgers, or use confirmation from other strong systems.
If you mark strategies in your Build Alpha portfolio as ‘Active’ then they can be used in ensemble strategies. The below selected signal would only enter a position when at least 2 (any 2 of your active strategies) already has a position. You can also select all the ‘at least’ signals and have the software find the best combinations of your existing strategies to use in an ensemble strategy.
This new feature in Build Alpha gives system traders an unique advantage never before offered. We can now create ensemble strategies at the click of a few buttons and completely automate them.

How Can I Make Ensemble Strategies Only Using The SPY Strategies?

If you have a few diverse strategies in your portfolio and want to create an ensemble only using a few of them then make sure the strategies you want to include in the ensemble are the only ones marked active in your portfolio. Below I’ve only marked the SPY strategies as active in my portfolio (left photo). Then when I select at least 2 on the right photo it means it will trade whenever at least 2 of the SPY strategies are in a position.

How Can I Make Ensemble Strategies Only Using The Non-SPY Strategies?

Simply change the active strategies in your portfolio by unselecting the SPY strategies and selecting the others.

How Can I Make Ensemble Strategies Using All The Strategies From My Portfolio?

You guessed it… just mark all as active. Now all strategies in our portfolio will be considered for ensemble strategies in Build Alpha’s strategy building process.
Note the above green box with the 1004 + 1000 numbers. This means that I have selected 1000 technical signals to use in the strategy building process plus 4 ensemble signals. I have also selected 1000 technical exit signals to include in the strategy building process. Now Build Alpha will create the best strategies it can given your inputs. You can also right click to ‘require’ any signal (including ensemble signals) to force the software to use that signal in the strategy building process.

Small Accounts

Ensemble strategies are great for smaller accounts too. If you cannot afford to trade multiple strategies, but have created a few then you can still capture the information of all the strategies by ensembling them into one ensemble strategy. Then you can trade this ‘master’ strategy with a smaller account than trading all the individual components. So better use of capital and less overfitting? Sounds good.

Ensembles: A Case Study

This is a simple case study showing the RSI2 strategy outlined in Larry Connors’s book Short-term Trading Strategies That Work. I have applied the strategy to the individual equity index ETFs and then shown the results of two different ensemble strategies of these four strategies applied to SPY.
The first ensemble strategy takes a position in SPY whenever two of the four individual RSI2 strategies have an existing position. It does not matter which two markets are trading at the moment, but it will trigger a SPY trade. This first ensemble strategy does better than three of the four individual components on most metrics, but specifically profit and loss to drawdown ratio.
Furthermore, if we look at the second ensemble strategy that only trades SPY when the RSI2 strategy has an active trade in all four of the equity indexes AND SPY is trading above its 200SMA then we can improve the profit and loss to drawdown ratio to over 10! Significantly better than any of the individual strategies.

Ensemble Methods Summary

Ensemble strategies combine multiple strategies to create a more powerful ‘master’ strategy. Ensemble strategies help reduce overfitting (curve fitting) which is the biggest plague us system traders and quant traders face. They have been shown in real-life trading, financially motivated contests, and as well as with large hedge funds to be superior to simpler trading strategies and machine learning models. BuildAlpha can now help you build, employ and automate ensemble strategies with a few clicks. Private videos for users now up!

2018 Year End Update

It is becoming more and more commonplace for large quantitative firms to use ensemble methods.
The future (and even the present) of quantitative finance is the discovery and deployment of ensembles of many marginal edges – even weak predictors. These smaller edges will not attract academic or practitioner interest because they may not be sufficiently profitable on their own, but combined in an ensemble can be very powerful. It is even believed Renaissance Technologies had this breakthrough a while ago and that has manifested/propelled them into the greatest Hedge Fund of all time.
A small and anecdotal example is the year end performance of this popularized RSI2 trading strategy. The individual strategy ran on the single markets resulted in
  • SPY -$17.5 per share traded
  • DIA +$0.24 per share traded
  • QQQ -$1.07 per share traded
  • IWM -$20.50 per share traded
  • Ensemble +$2.79 per share traded
An overall weak year for this strategy, but improved by the ensembling described above. Ensembles are just another tool in our arsenal with Build Alpha to build the trading portfolio we need! Cheers guys.
Thanks for reading,

Author

David Bergstrom – the guy behind Build Alpha. I have spent a decade-plus in the professional trading world working as a market maker and quantitative strategy developer at a high frequency trading firm with a Chicago Mercantile Exchange (CME) seat, consulting for Hedge Funds, Commodity Trading Advisors (CTAs), Family Offices and Registered Investment Advisors (RIAs). I am a self-taught programmer utilizing C++, C# and python with a statistics background specializing in data science, machine learning and trading strategy development. I have been featured on Chatwithtraders.com, Bettersystemtrader.com, Desiretotrade.com, Quantocracy, Traderlife.com, Seeitmarket.com, Benzinga, TradeStation, NinjaTrader and more. Most of my experience has led me to a series of repeatable processes to find, create, test and implement algorithmic trading ideas in a robust manner. Build Alpha is the culmination of this process from start to finish. Please reach out to me directly at any time.
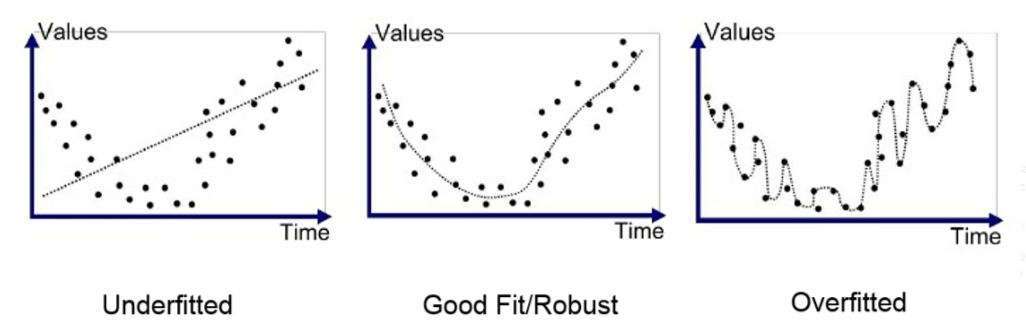
A different strategy for each day of the week? Sounds crazy, but is it?
I have wrote about “Turnaround Tuesday” before.
This simple strategy is actually at new highs since this was published over 10 months ago!
But what about other markets? Is it possible to just trade one market per day of the week (from open to next day’s open) on a specific day of the week and still do well? If you would have followed this simple “portfolio” below for the past 15+ years then yes.. you would have. You wouldn’t even of had to sit in front of the screens like the rest of us degenerates..

Strategy 1: Short Crude Oil on Mondays

Strategy 2: Turn Around Tuesday

Strategy 3: Long Gold on Friday's. Weekend Risk.

Maybe in lieu or anticipation of bad weekend news releases, buying Gold on Friday’s open and holding over the weekend to exit on Monday’s open has produced the following based on 1 lot.

Portfolio of Strategies

Not a bad portfolio equity curve, right?! One of the hidden ‘holy grails’ in trading is combining systems together to smooth the equity growth of the account. No one single super star out of any of these 3 strategies but combined their curve starts to look rather nice.

Utilizing Build Alpha for Seasonal Edges

Sure these might not be alpha generators on their own but maybe they can be combined with some other price patterns, filters or targets and stops to become full strategies. They can certainly act as intermarket or multi-time frame filters for more complicated strategies.
For example, if you have a 60-minute mean reverting system that buys oil dips then maybe it should be turned OFF on Mondays! At the very least it is worth a look, and this is all made very simple with Build Alpha – just point, click, test.

Odd vs Even Days

For example, did you know S&P500 has performed much better on even days than odd days? (April 6 is an even day).

Takeaways

Anyway, I just wanted to show some simple things that can be tested in Build Alpha and how sometimes the simplest ideas turn out to work the longest. Maybe because people think they’re too simple and that they can’t work? I don’t know.
Either way I have put some python code (and TradeStation code) in the private Build Alpha users’ forum to specify day of the week as I know a lot of you are trying to learn python so I figured I’d help out a bit. But day of week is all point and click options pre-built into Build Alpha’s signal library for those of you who could care less about learning to code! Build Alpha has support for various seasonal filters such as:
  • Day of week
  • Day of week combos
  • Trading Day of Week
  • Trading Day of the Month
  • Trading Days Left in the Month
  • Trading Day of Quarter
  • Trading Day of Year
  • Month
  • Quarter
  • Even or Odd
  • and More
Happy Friday.
Cheers fellas,

Author

David Bergstrom – the guy behind Build Alpha. I have spent a decade-plus in the professional trading world working as a market maker and quantitative strategy developer at a high frequency trading firm with a Chicago Mercantile Exchange (CME) seat, consulting for Hedge Funds, Commodity Trading Advisors (CTAs), Family Offices and Registered Investment Advisors (RIAs). I am a self-taught programmer utilizing C++, C# and python with a statistics background specializing in data science, machine learning and trading strategy development. I have been featured on Chatwithtraders.com, Bettersystemtrader.com, Desiretotrade.com, Quantocracy, Traderlife.com, Seeitmarket.com, Benzinga, TradeStation, NinjaTrader and more. Most of my experience has led me to a series of repeatable processes to find, create, test and implement algorithmic trading ideas in a robust manner. Build Alpha is the culmination of this process from start to finish. Please reach out to me directly at any time.
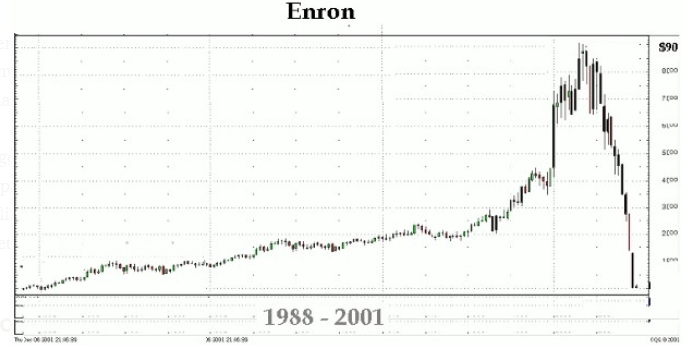
I want to discuss three trading “truths” that I often heard but when I finally got into testing ideas, I found them to be myths. These discoveries were instrumental in turning my trading around.

For those that know my story, it was not all roses and rainbows – what trading story is?!? I actually “learned” like a lot of traders from online sources, chat rooms, webinars, and eventually found the right circles to roam in after a LOT of trial and error. I was then lucky enough to land a job with a high frequency trading firm. I was quickly made to realized that much of what I thought trading “was” was most certainly false.

In an attempt to show me the light, a few of the quick trading axioms they wanted to disprove to me were simple “well known” trading ideas that have been around for years but were in fact large falsehoods. I quickly realized beyond this list of three examples there must have been many, many more “trading truths” that were causing my account harm and doing my trading aspirations a disservice.

I then realized the value in testing everything and quantifying my entire approach. It wasn’t until this point in my journey did I get out of the “rat race” of trading… the ups and downs, the barely consistent, always doing slightly better but not really getting anywhere trading most of the traders I meet today are going through.
I cannot stress the importance of testing everything and quantifying your trading edge. Investigate these trading axioms. Otherwise, you will be stuck in randomness until your account random walks to 0. For more on my journey check out this podcast I did chatwithtraders.com/103
Below you will find my three favorite trading “truths” quantified.

Trading “Truth” #1 - Bearish Engulfing Candle

This one is great because many are familiar with Japanese candle stick patterns and the name implies such a negative move in price that one cannot help but to shift their bias to the downside. These candlestick patterns are often traders first introduction to technical analysis.
The pattern is defined as a bearish candle that “engulfs” the range of the previous day. I also like to look for a negative close and preferably a close below the previous session’s low. Here are a few pictures of bearish engulfing candles.
The truth is that this pattern has been one of the most bullish (not bearish) one day signals for the SP 500 over the past 15+ years. Did you know that the day following a bearish engulfing candle actually closes higher 61.72% of the time in the SP500 futures and 65.33% of the time in SPY ETF? The day following a bullish engulfing candle only closes higher 54.05% of the time in the SP500 futures and 51.70% of the time in SPY. You tell me why they’re named how they are!

Trading Truth #2 – Above a moving average is bullish and below is bearish

Most of the time this is true but it depends on the moving average, moving average length, and the market. I recently came across a few blogs that mentioned using a short term moving average as a sign to exit long market exposure and wait for sunnier days. In reality, this sounds great; however, analyzing the data this can be an extremely misleading “truth”.
Below is a chart plotting the equity curve if you would buy every close when the SP500 is BELOW the 8 period simple moving average (8SMA) and sell the next bar (repeating until above 8SMA). The second chart is if you were to buy every close when the SP500 is ABOVE the 8SMA and exit the next bar (repeating until below 8SMA). Yes, being below this moving average is actually better for long returns.
Of course this is not true for all markets and moving averages, as mentioned. I pointed this out in another post on SeeItMarket where I dissected popular stocks and different moving average lengths here: https://www.seeitmarket.com/testing-moving-averages-popular-stocks-etfs-16809/
The point is that these trading truths like “above a moving average is bullish” and “below a moving average is bearish” need to be quantified and tested. It is important to stop thinking trading truths can be generalized to every market, timeframe, indicator value, etc. and just verify them yourself and you’ll be much better off!

Trading Truth #3 – Overnight Exposure is Risky

Sure earnings announcements and large unexpected news announcements typically happen after market close. Does this mean we should avoid trading overnight, if possible? So many want to day trade and be flat on the close that they miss a lot of gains from the overnight session (sometimes all of them).
Below you will see 30 top stocks where I breakdown their returns in the day session compared to the overnight session. The blue line signifies if you bought the open and sold the close the same day (day session) and the orange line signifies buying the close and selling on the next day’s open (simulating overnight exposure). As expected, there are no generalities in trading truths. Some stocks exhibit that most, if not all, returns come from the overnight.
Don’t get me wrong there are certainly edges to be had from avoiding overnight exposure and there can also be value added by increasing overnight exposure. Again, I am just making the point to dig deep into the data and understand where the edge(s) actually live.
Quick note: You can easily test overnight holds in Build Alpha by setting max hold to 1 bar and setting entry to this bar close and exit to next bar open in the settings menu.

In conclusion

Not all trading truths are “truths”. There are many that still have value! The edge is not in these truths but in determining the difference between a truth and a “truth”. Most do not take the effort to investigate these trading axioms found in trading books, blog sites, chat rooms, etc. If I have one goal then it is to make traders realize the value in testing everything – it is something I wish I would have started earlier. It is a super power to quickly test these ideas and trade/act accordingly!
I think many traders shy away from digging into the data because it requires effort and they think it will be a hard and arduous journey before they find some gold. But now I think it is increasingly easier than many may think.
That’s why Build Alpha’s main goal was (and still is) to make this type of testing easier for those with no programming skills or those tired of crunching endlessly in excel. The game is changing and things like this can be easily tested now. Now trading just comes down to those who will put in the work and who won’t: this should greatly increase your odds for success if you’re part of the former group.
Thanks for reading

Author

David Bergstrom – the guy behind Build Alpha. I have spent a decade-plus in the professional trading world working as a market maker and quantitative strategy developer at a high frequency trading firm with a Chicago Mercantile Exchange (CME) seat, consulting for Hedge Funds, Commodity Trading Advisors (CTAs), Family Offices and Registered Investment Advisors (RIAs). I am a self-taught programmer utilizing C++, C# and python with a statistics background specializing in data science, machine learning and trading strategy development. I have been featured on Chatwithtraders.com, Bettersystemtrader.com, Desiretotrade.com, Quantocracy, Traderlife.com, Seeitmarket.com, Benzinga, TradeStation, NinjaTrader and more. Most of my experience has led me to a series of repeatable processes to find, create, test and implement algorithmic trading ideas in a robust manner. Build Alpha is the culmination of this process from start to finish. Please reach out to me directly at any time.