What is System Trading?

System trading is a data-driven, disciplined approach that uses a set of rules and a pre-defined process to make trading decisions, issue buy and sell orders, or execute a trading system.
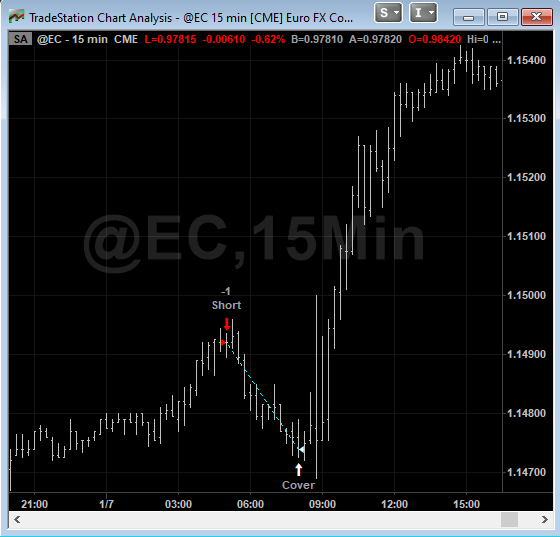
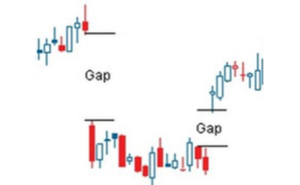
The simplest example would be to think of an “If, then” statement. That is, if X happens then do Y. For instance,
System traders do not deviate from their system and have no or very little manual intervention. The trading rules and long-term process should drive the trades and positions as well as account for various market conditions.
The best traders of all time including the best hedge fund of all time, Rennaissance Technologies, are famously known as system traders.

What is a Trading System?

A trading system is a set of rules that determine the buy and sell signals based on the market data. A proper trading system should also account for position sizing, risk management, and other key factors.
A trading system can incorporate price action, volume, volatility, technical analysis, fundamentals, market breadth, economic data, news events, intermarket analysis, multiple timeframe analysis, system performance, seasonal factors, and more to determine trading decisions. It is entirely up to the trader to backtest how the trading system would perform in various financial conditions.

Automated or Not?

A trading system does not need to be fully automated and can still be executed manually. This is more commonly referred to as ‘hybrid trading’ where the trader utilizes data and statistics to find trading edges but does not fully automate the trading system but rather manually executes the trades whenever an alert is received.
There are many advantages to full automation which I cover in-depth in my Algorithmic Trading Guide but here are a few quick ones
Most system traders code their strategy logic or trading systems so that execution happens automatically. If you cannot code or program, keep reading to find out how you can still create automated trading strategies with no coding. Jump Ahead

System Trading vs. Discretionary Trading

Discretionary trading relies on intuition, gut-feel, in-the-moment decision making, and unreliable execution. System trading relies on tested data and statistics paired with reliable execution. After spending a decade-plus in the professional trading world, I am a bit biased. However, listen to Jim Simons – founder of Renaissance Technologies – talk about the importance of treating trading like a business and the necessity of having a trading system. Watch from 36:48 to 38:02.

“That religious sticking to the model is the only way you can run such a business. Because you cannot simulate that guy that walked in and said ‘Hey, Google is too high. Let’s sell it’. How can you simulate that? You don’t know what might have happened.”

Discretionary Trading Pitfalls

What you see is not the same

Humans are prone to seeing delusions and recognizing patterns where there are not any. It is part of our survival mechanism and the market preys on this. For instance, do you see a duck or a rabbit?
Half the traders see one thing and half the traders see the other. This is no way to build a reliable business or risk your hard-earned capital.

Two or more patterns on the same chart

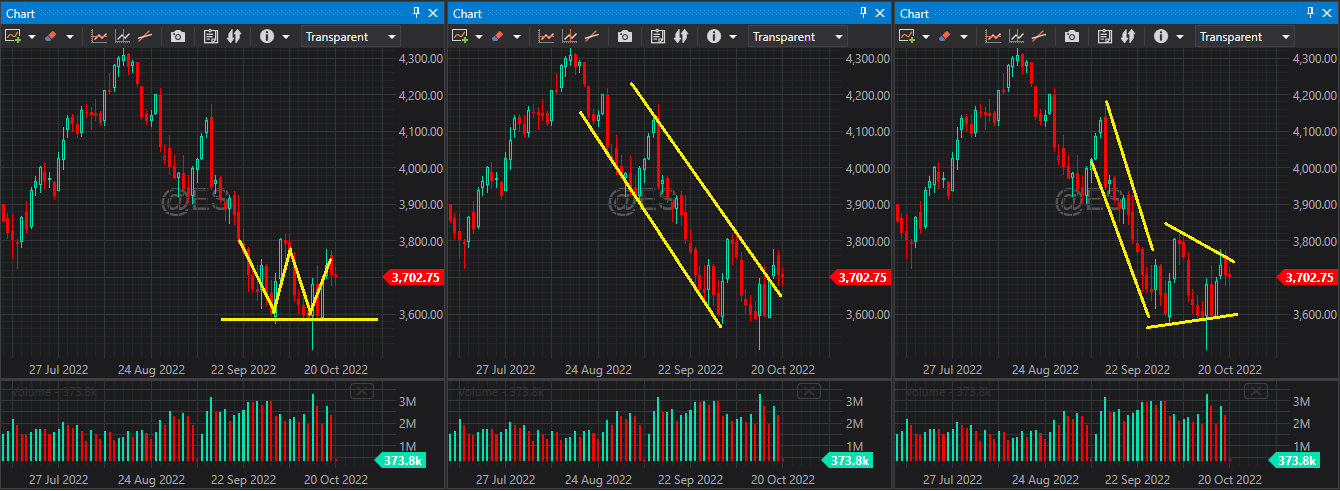
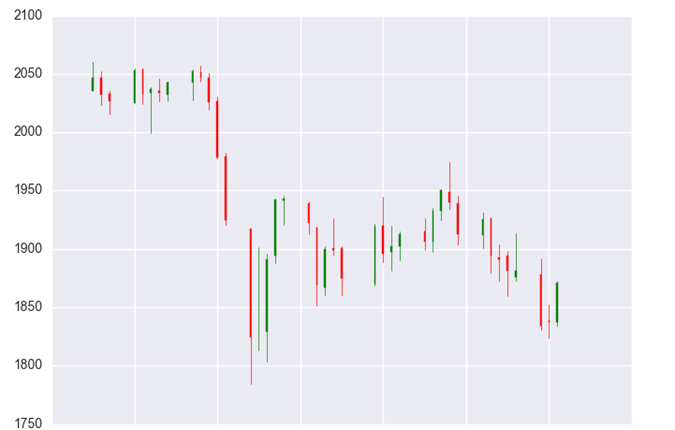
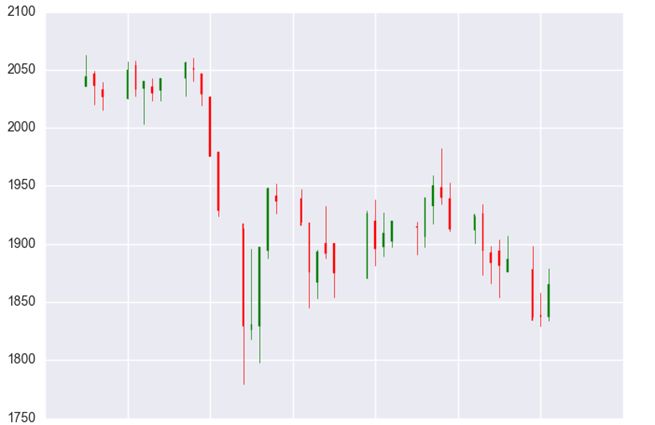
Driving the previous point home in another way. Notice this chart below covers the same date range but can easily show multiple different technical analysis chart patterns depending on who you give the crayon to. Double bottom, channel breakout, bear flag, go-broke special.
Technical Analysis can be misleading - Build Alpha

Linear vs Log Charts

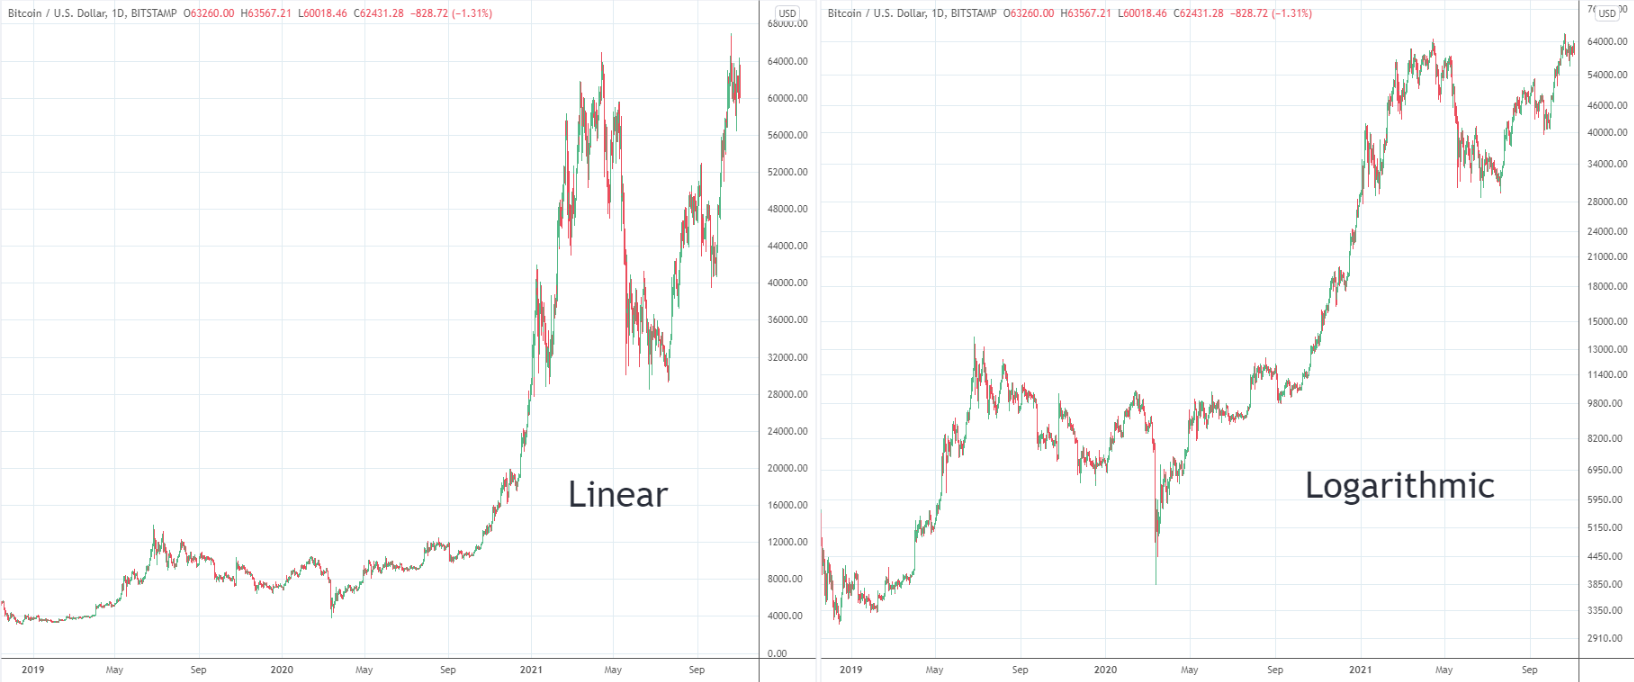
Do you use linear scale or log scale charts? How we even set up our trading charts will determine what patterns and peaks and valleys line up. This presents a whole new can of worms that make it problematic to build a business off of discretionary methods lacking testable insights.
Linear vs Logarithmic Trading Charts

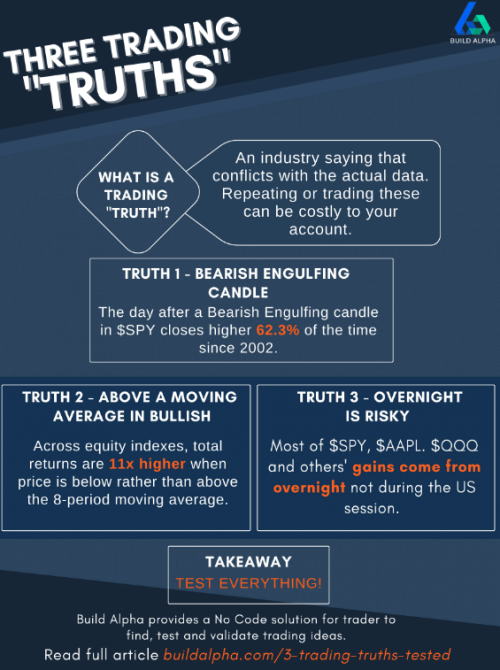
Trading “Truths”

The big players need liquidity to exit their positions and in order to do so they need a lot of retail traders to take the other side of their trade. This has created astute institutional and professional traders to abuse old trading axioms and sayings (that may have used to work) to their advantage.
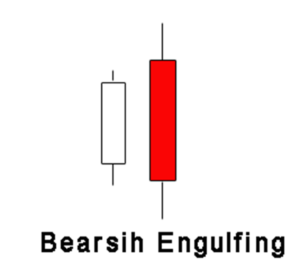
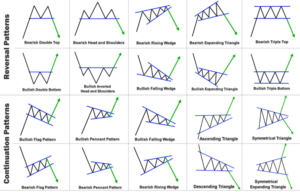
The market marketing machine teaches new traders simple sayings and patterns with obvious names like bearish engulfing candle or bullish flag pattern to initiate a new flock of fish to take the opposite side of their trades.
I wrote about three of these common trading “truths” in this blog debunking them and showing the data of what actually happens. All the more reason to test everything and build trading systems rooted in data.

What is Mechanical Trading?

Mechanical trading is the process of having pre-determined rules generate trade entry and exit signals. Mechanical trading is simply another way of describing system trading or automated trading. System trading or Mechanical Trading can be used for day trading, trend following, mean reversion, arbitrage or any other type of trading idea.

Mechanical Trading Strategies

Turtle Trading

The original story covers 23 novice traders hired to execute a trading system as part of an experiment set up by two professional traders. The goal was to see if regular people could achieve success following a trading system.
The story is fascinating and the strategy itself is disclosed in the famous books The Complete Turtle Trader and Way of the Turtle. The strategy’s performance has since waned but can be thought of a simple breakout strategy executed across commodities with some volatility-based sizing.

Ichimoku Trading Strategy

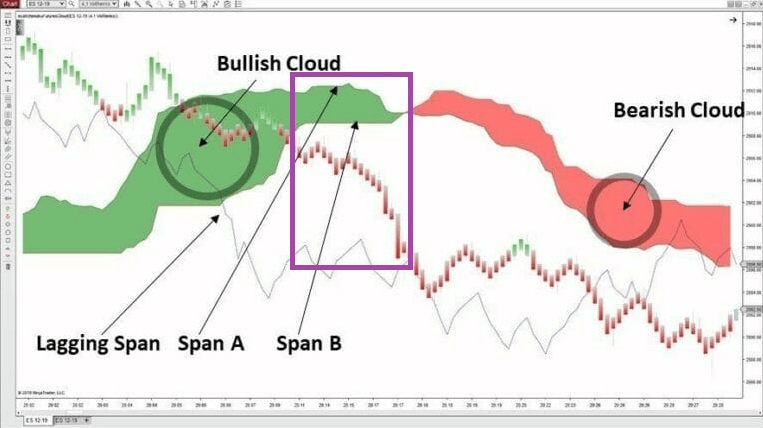
The Ichimoku Cloud technical indicator uses a series of moving averages with different lookbacks and offsets to create a “price cloud” (pictured below). I placed a purple box to show most of the price collapse happened during the “bullish cloud phase”.
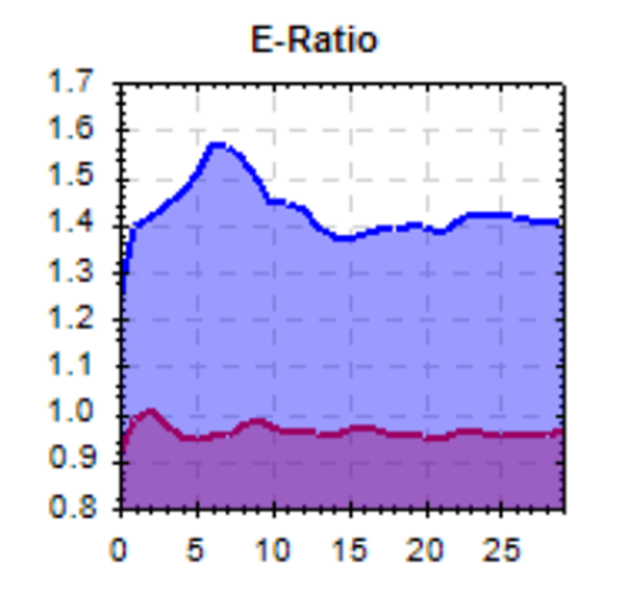
This indicator is often popularized because the creators claim that it can predict future price movements. However, this may be another trading “truth”, as most testing does not show a positive edge or e-ratio.

Forex Robot Trading

This is an alternative word for automated trading systems or algorithmic trading in the forex industry. I am not sure why the forex industry has taken to the terminology robot but one can consider these all the same.
Trading systems can be applied to any timeframe, bar type, or asset class including forex and cryptocurrencies. I have given away a handful of successful “forex trading robots” including this one below. Although, you will hopefully never hear me use this phrase again.
For those interested in Forex Algo Trading

What is an alternative trading system?

An alternative trading system (ATS) is an electronic trading system that matches orders for buyers and sellers of securities and are often SEC-regulated but not national securities exchanges. Alternative trading systems are more considered trading venues that are more loosely regulated than exchanges, not to be confused with a rules-based trading system for executing buy and sell orders as we have been discussing in this post. A few examples of alternative trading systems would be

Can you have an automated trading system with no code?

Build Alpha Trading System Software

Yes, Build Alpha is a no code strategy generator that I have been building for the past half-decade or so. This software allows traders to select entries, exits, risk management, and more from a point-and-click interface and the genetic algorithm (strategy engine) will find the best strategies for you.
After finding strategies that meet your desired risk controls and robustness tests you can monitor the strategy live to receive real-time alerts and position changes or hit a button to generate fully automated code for a variety of popular brokerage platforms such as TradeStation, NinjaTrader8, MetaTrader4, MetaTrader5, Python, and more.
Watch this demo video to see how fast I can build
Please note this video is a few years old. Check out the Build Alpha Demo page to see new versions of the software.

Summary

System trading is a data-driven approach that requires a set of rules that determine entry, exit and sizing of a trading strategy. A trading system can be executed manually or automatically but should involve very little or no human intervention. Traders struggling with emotions, discipline, or finding quantifiable edges should investigate system trading. Build Alpha enables traders with no coding experience to build, test, and automate their trading systems. Shoot me an email anytime to learn more.

Author

David Bergstrom – the guy behind Build Alpha. I have spent a decade-plus in the professional trading world working as a market maker and quantitative strategy developer at a high frequency trading firm with a Chicago Mercantile Exchange (CME) seat, consulting for Hedge Funds, Commodity Trading Advisors (CTAs), Family Offices and Registered Investment Advisors (RIAs). I am a self-taught programmer utilizing C++, C# and python with a statistics background specializing in data science, machine learning and trading strategy development. I have been featured on Chatwithtraders.com, Bettersystemtrader.com, Desiretotrade.com, Quantocracy, Traderlife.com, Seeitmarket.com, Benzinga, TradeStation, NinjaTrader and more. Most of my experience has led me to a series of repeatable processes to find, create, test and implement algorithmic trading ideas in a robust manner. Build Alpha is the culmination of this process from start to finish. Please reach out to me directly at any time.

How to Download TradeStation

If you have not already downloaded TradeStation, then please do so before continuing with this backtesting on TradeStation guide. First, head to the TradeStation’s home page to login to your Client Center. Next, select the Download Software tab in the top menu. At the time of writing, TradeStation offers both version 9.5 and version 10. Build Alpha and this guide are compatible with both. Additionally, TradeStation has a great installation video and user guide here:

Create a Strategy for Backtesting and Live Trading

In order to backtest, we need a strategy. There are two ways to create a strategy for backtesting and live trading in TradeStation. One requires coding and one does not.

Easy Language Development Environment

TradeStation’s proprietary coding language, called Easy Language, was designed to make programming easy for traders. TradeStation handles all of the “no fun” tasks like data connectivity, order routing, and account monitoring while traders get to focus on the logic of the strategy.
Easy Language allows traders to express their trading ideas in almost human readable syntax. Below is an example of a moving average crossover system that buys 100 shares on a cross above and sells 100 shares on a cross below
If Close[0] crosses above Average(Close,10)[0] then buy 100 shares next bar open;
If Close[0] crosses below Average(Close,10)[0] then sell 100 shares next bar open;
Learning the ins and outs of easylanguage are not as gruesome as learning a traditional programming language. In addition, TradeStation has great documentation and tons of pre-built-in functions for all popular indicators.

Build Alpha and Generated Code

Build Alpha is a no code strategy builder that enables traders to build, test, and generate code for tons of automated trading strategies. This presents an option for those that do not want to learn how to program but still want to do algorithmic trading.
After generating a strategy, simply hit the ‘Generate EL Code’ button to get full code. This code can be copy and pasted into TradeStation’s Development Environment as if you coded it yourself.

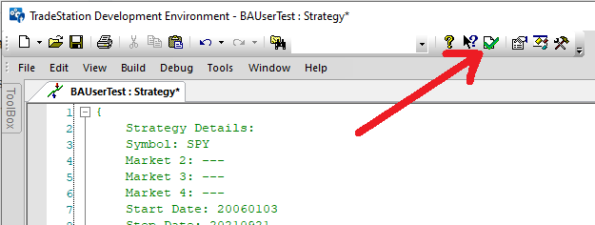
Compile or Verify the Strategy

Whether coded yourself or built with Build Alpha, we must save the strategy in TradeStation’s development environment. To do so follow these steps

How to Add a Strategy to a Chart

Ok, now that we have a trading system how do we view it on a chart? The next step to properly backtest on the TradeStation trading platform is to open a chart.

Step 1 Open a New Chart

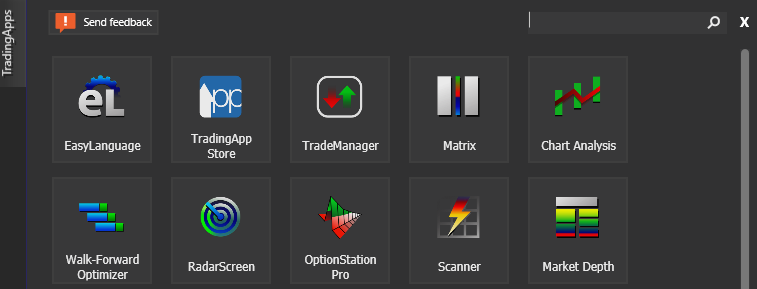
In the File menu, head over to View >> TradingApp Launcher >> Chart Analysis. Alternatively, one can do File >> New >> TradingApp Window >> Chart Analysis.
Double-click on the prices to access the settings. You can adjust the date range, candlestick type, timeframe, and symbol. Alternatively, you can right-click on the chart and select Format Symbol to do the same.

Step 2 Insert Strategy

Now that our chart is set, we need to insert the strategy onto the chart. From the File menu you can Insert >> Strategy or you can right-click on the chart and select Insert Strategy.
Next, select your desired strategy. You should see the trades appear on the chart.

Step 3 Turn on and configure settings

Let’s make sure our strategy settings are correct. Right-click on the chart and select Format Strategies or double-click on one of the entry or exit arrows to open the settings menu.
To automate the strategy, one must
Please note these steps are the same for simulated trading and live accounts. Always confirm which account you are signed into prior to automating anything!

Max Bars Back and sufficient market data

The trading software needs sufficient data to calculate whatever it is your trading systems do. TradeStation has a setting called “Maximum number of bars study will reference” but it is more colloquially known as “Max Bars Back”.
This setting instructs TradeStation how many bars to wait before the trading strategy should begin trading. If your strategy uses a 200-period simple moving average, then it would be wise to set the Max Bars Back to 201.
To find this setting, right-click on the chart and select Format Strategies. In the next window, choose the “Properties for All” tab and look in the lower left. After setting an appropriate value hit OK and then continue to hit Close on the Format Analysis Techniques & Strategies window.
This setting is meaningful regardless of timeframe, tick data, daily, weekly, etc. as TradeStation considers bars.

Advanced Automation Settings in TradeStation

We have now set up a simple strategy with simple settings. TradeStation has many more noteworthy settings. In the Properties for All window, there are three tabs across the top. Select the ‘Automation’ tab to see a new set of configurations.

Fill historical orders

The first option is to instruct TradeStation on what to do when your strategy logic generates an order, but the market does not give you a fill. The default setting is to change your limit order to a market order 15 seconds after the strategy logic generates an order (assuming no fill).

Multiple Strategies on the Same Symbol

The next option to enable is if you will have multiple strategies for the same symbol. TradeStation will make sure one strategy’s exit does not close out a position from another strategy if you select the “Allow multiple automated strategies on multiple charts using the same symbol” option.

Stop Orders

Finally, enable TradeStation to send stop orders to their own server. This is an underrated feature and worth explaining. If your TradeStation account is down, internet goes out, lose power, etc. while you have an open position then this may save you. TradeStation will notice stop orders from your strategy logic and house them on their server. If you lose power, no problem, your order is still live on a TradeStation Technologies Inc server.
Read more

Viewing the Strategy Performance Report

How do we view our back test results? After loading the strategy on the chart we can view the Strategy Performance Report. To open the report you can either
The report is extensive and has many options. I will briefly describe them all below
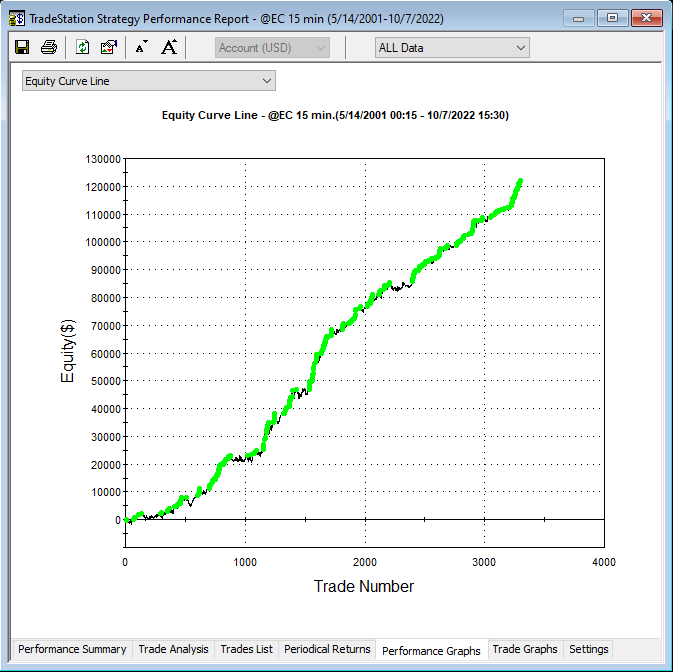
You can also save or print this report in the upper left near the File menu. Reminder, backtest results are not indicative of future results.
Read more

Importing Trading Strategies into Build Alpha

TradeStation is great but is missing many advanced tools professional system traders require or only has them in a limited capacity such as
Luckily, the Strategy Performance Report can be saved to a csv or excel file and imported into Build Alpha. Build Alpha has a converter that can take these Strategy Performance Reports and import any strategy.
Build Alpha offers more advanced robustness testing and portfolio testing than TradeStation does. This is also a way to combine your TradeStation strategies with your Build Alpha strategies to do more thorough research.

TradeStation Backtesting Summary

TradeStation securities offers a trading platform, brokerage account, and programming language called easylanguage for systematic traders. Traders can load strategies onto real time charts and view past performance, the trades on a chart, and various performance results. TradeStation has data for all assets such as Futures, Stocks, ETFs, forex, cryptocurrencies and various indexes. Build Alpha provides a no code strategy builder to produce fully automate-able Easy Language code for TradeStation.
For those interested in getting started with Build Alpha and TradeStation, please reach out to me to find out how TradeStation will cover your Build Alpha license cost. Read more here TradeStation and Build Alpha promo

Author

David Bergstrom – the guy behind Build Alpha. I have spent a decade-plus in the professional trading world working as a market maker and quantitative strategy developer at a high frequency trading firm with a Chicago Mercantile Exchange (CME) seat, consulting for Hedge Funds, Commodity Trading Advisors (CTAs), Family Offices and Registered Investment Advisors (RIAs). I am a self-taught programmer utilizing C++, C# and python with a statistics background specializing in data science, machine learning and trading strategy development. I have been featured on Chatwithtraders.com, Bettersystemtrader.com, Desiretotrade.com, Quantocracy, Traderlife.com, Seeitmarket.com, Benzinga, TradeStation, NinjaTrader and more. Most of my experience has led me to a series of repeatable processes to find, create, test and implement algorithmic trading ideas in a robust manner. Build Alpha is the culmination of this process from start to finish. Please reach out to me directly at any time.

Who is Jim Simons?

Jim Simons, born in 1938, is often referred to as “the most successful hedge fund manager of all time” and the “greatest investor on Wall Street”. The Financial Times named him “the world’s smartest billionaire” in 2006. Simons is the founder of Renaissance Technologies, a quantitative trading hedge fund based out of New York, that boasts an incredible 66.1% average annual return since 1988. Simons’ approach to the markets is fully systematic and there is so much to glean from his work as Jim Simons launched the quant revolution. This article will examine Simons’ many accomplishments and a few takeaways that can help us become better system traders.
If you are not interested in his origins and rather skip ahead to the systematic trading parts choose below

Mathematician

Simons began as a mathematician and arguably had a full career before leaving to start Renaissance Technologies. He studied mathematics at Massachusetts Institute of Technology (MIT) and later got his Ph.D. from the University of California, Berkeley.
Simons put his mathematics skills to the test working with the National Security Agency (NSA) to break codes during the Cold War while simultaneously teaching at MIT and later Harvard University. After his public opposition to the Vietnam War, Simons was forced out but later appointed chairman of the math department at Stony Brook University.
Simons is known for his studies in pattern recognition and developed the Chern-Simons form with Shing-Shen Chern and is credited with contributions toward the development of String Theory. His theoretical framework combined geometry, topology, and quantum field theory.
Simons has formally received recognition in mathematics, geometry, and topology before shifting his focus to finance in the late 1970s

The Greatest Trader on Wall Street

Jim Simons founded Renaissance Technologies in 1982 as a 40-year old retired mathematics professor. However, he left his job/academia to start his first hedge fund Monemetrics in 1978. This fund was moderately successful and employed both fundamental and technical approaches to the market, but Simons felt “gut wrenched” by the emotional swings.
Simons decided to use a purely systematic approach to avoid emotional rollercoasters and avoid common trading biases that trip up most traders. Simons staffed the new fund, Renaissance Technologies, with mathematicians, computer scientists, and physicists to pioneer a new approach to algorithmic trading.
Since 1988, Jim Simons’ Renaissance Technologies flagship fund, the Medallion Fund, has returned an average of 66.1% per year which shatters any other publicly available returns over the same horizon. Later I will dissect what little information is available about Simons’ (and RenTec) strategies, approach and success. Skip ahead
Simons is quoted as saying his best algorithm has always been
“you get smart people together. You give them a lot of freedom. Create an atmosphere where everyone talks to everyone else. They’re not hiding in a corner with their own little thing. They talk to everybody else. And you provide the best infrastructure, the best computers and so on that people can work with. And make everyone partners. So that was the model that we used in Renaissance. So we would bring in smart folks and they didn’t know anything about finance, but they learned.”

Philanthropist

Jim Simons has given over $2.7 billion to philanthropic causes ranging from education and health to scientific research. In 1994, Simons and his wife Marilyn Hawrys Simons co-founded the Simons Foundation which later established the Simons Foundation Autism Research Initiative in 2003.
This foundation founded Math for America in 2004 and Simons later doubled the initial $25 million pledge in 2006.
Simons’ alma maters and former academic employers have been benefactors from Simons’ trading successes with large contributions to University of California Berkley, MIT and Stony Brook. His most recent contributions have been aimed to advance computational science and mathematics.

Jim Simons Renaissance Technologies Medallion Fund

Medallion Fund Beginnings

Simons started in the late 1970s and was met with some initial success. However, Simons questions whether the early success was more luck than skill. Primarily focused on commodity futures using fundamental and technical analysis, Simons never achieved the emotional clarity or systematic approach to have full trust.
In 1988, Simons set up the Medallion Fund with a focus on huge amounts of data diversifying across timeframe, asset class, and pattern. Adding the stock market how Jim Simons and team gained additional success. However, the big success did not come until the early 1990s when he brought Bob Mercer and Peter Brown on board from IBM.
Bob Mercer and Peter Brown
Mercer was a large donor in the 2016 US Presidential election (Trump) and eventually left the firm in 2017 after political differences.

Medallion Fund Fees

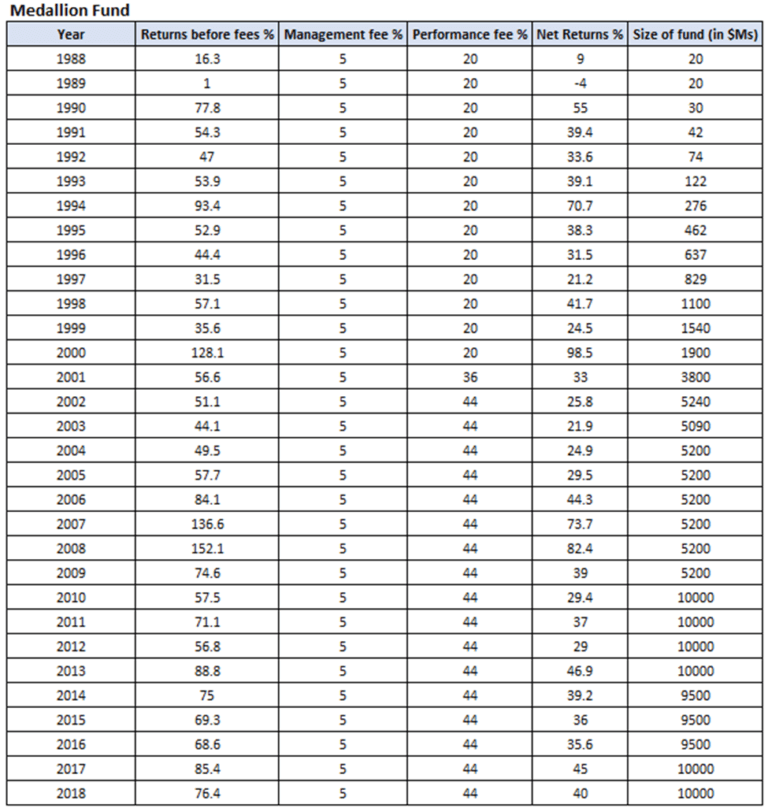
Most hedge funds charge “2 and 20” which is shorthand for an annual 2% management fee and a 20% rake on performance. Simons knew he had something special and offered investors “5 and 20” in the early days of Medallion but has since moved toward a “5 and 44” structure. This %5 management fee and 44% profit take may be the most aggressive fees in the industry, but Simons and the Medallion Fund have earned them. Due to the large fees, the net returns are more in line with a 39.1% average annual return instead of the earlier stated 66.1%. However, 39.1% is still remarkable with such a large capital base.

Medallion Fund Performance

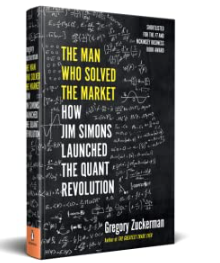
Gregory Zuckerman’s book The Man Who Solved the Market shares Medallion’s annual returns in Appendix 1.
Now most of the investors and owners in the fund are employees as Medallion takes no outside capital.
Assuming the net returns column over the most recent 20-year span then an investor would have experienced the growth of a $1,000 investment into a whopping $906,933.26.

Medallion Fund vs. S&P500

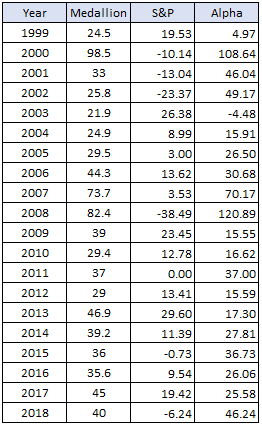
Assuming the past 20 years S&P 500 returns then the same $1,000 invested in the S&P500 would return an impressive $2,039.12. This is a far cry (about 500x smaller) than the return generated by the Medallion fund. There is beating the market, capturing alpha, and then the universe that Medallion and Simons are from. Here are the side-by-side returns:
Medallion Fund vs S&P500 Returns Comparison

Medallion Fund Takeaways

Jim Simons Net Worth and Personal Life

Billionaire Status and Forbes List

Jim Simons is the current richest trader in the world with a $28.1 billion dollar net worth ranking him on the Forbes list. He has the highest net worth of any trader or money manager on the Forbes wealthiest list. For example, Simons has a wealth more than three times that of George Soros.

Archimedes Yacht

Jim Simons owns a $100 million yacht with an annual running cost of $8 to $10 million. The 68-meter (222 ft) yacht is appropriately named Archimedes after the famous mathematician. Archimedes the superyacht sleeps 12 in 6 cabins and has room for 18 crew members on board with a dining hall for 20 guests. The yacht was built at the Dutch yacht builder Royal Van Lent and delivered to Simons in 2008. Let’s face it, these big boy toys are half the allure of trading.

Private Jet

Simons also owns a $70 million Gulfstream G650 private jet. You can charter one of these bad boys for about $10,500 per hour, if interested.
Jim Simons Gulfstream G650 Private Jet

Tragedy

Unfortunately, Simons’ 84-plus years have not been without tragedy. In 1996, his son Paul was struck and killed by a car while riding his bicycle on Long Island. Paul was 34 at the time. In 2003, Simons’ son Nicholas, 24 at the time, drowned while on a trip to Bali, Indonesia.

Bonus Fact

Simons does not like, nor does he wear socks. Not sure if there is any correlation to his trading success but perhaps if you are struggling remove the feet prisons. I don’t know.

Jim Simons Quant Trading Insights

As all traders, I am always reading, learning, and trying to find a new piece that can help improve performance, limit drawdown or push me forward. The aforementioned book about Simons came out in 2019 and I devoured it in a weekend. I originally posted some thoughts on a See It Market blog here: 5 Lessons From One of the Greatest Traders of All Time (Jim Simons) – See It Market but want to elaborate on the insights and their application to system trading, Build Alpha and my own musings.

Edge is Important – Not Why It Exists

Simons does not care to explain the hypothesis or explanation of why a predictor or model works. If a predictor has edge and is statistically significant then why bother with some explanation for why it must work.
If the edge can be explained, then others are probably aware of the edge and others will soon trade it away.
In other words, data mining is ok. I’ve long defended this approach since the launch of Build Alpha and is nice to hear Simons echo similar ideas.
In my opinion, it is possible we cannot comprehend why a pattern or edge exists because it exists in a dimension too complex for our current understanding. Discarding an edge because we cannot explain it is a mistake.
Remove human bias and let the data show you where, when, and how to trade. Let others overlook these “unexplainable” patterns.
Excerpts to drive the point home
“Simons and his researchers didn’t believe in spending much time proposing and testing their own intuitive trade ideas. They let the data point them to the anomalies signaling opportunity. They also didn’t think it made sense to worry about why these phenomena existed. All that mattered was that they happened frequently enough to include in their updated trading system, and that they could be tested to ensure they weren’t statistical flukes”. (pg 109)
“Simons and his colleagues hadn’t spent too much time wondering why their growing collection of algorithms predicted prices so presciently. They were scientists and mathematicians, not analysts or economists. If certain signals produced results that were statistically significant, that was enough to include them in the trading model” (pg 150)
“I don’t know why the planets orbit the sun. That doesn’t mean I can’t predict them” – Simons (pg 151)
“More than half of the trading signals Simons’s team was discovering were non-intuitive, or those they couldn’t fully understand. Most quant firms ignore signals if they can’t develop a reasonable hypothesis to explain them, but Simons and his colleagues never liked spending too much time searching for the causes of market phenomena. If their signals met various measures of statistical strength, they were comfortable wagering on them.” (pg 204)
“Volume divided by price change three days earlier, yes, we’d include that” – Simons (pg 204)
To read on how to quantify trading edge check this out

Stick to Your Model

You cannot run a trading business that relies on your emotional state or gut-instincts. There are too many days where you may be sick, tired, hungover, dealing with personal issues and what happens when these days line up with the most opportunistic market days?
Simons is 100% systematic and preaches the importance of treating trading like a business that can be backtested, modelled and followed. Here’s a quick minute long video where he explains why:

You Need a Great Team

Simons is no doubt successful on his own right, but Medallion’s performance really skyrocketed when Simons started building his team. Jim doubled salaries to hire people away from prestigious positions in tech, science, and academia.
Being around other smart, successful, and innovative people will only push you farther. The old saying “if you want to go fast go alone but if you want to go far go together” applies here.
Seek out other like-minded individuals and be open to sharing ideas. This is one of the greatest reasons I keep Build Alpha open to other traders. The ideas, inputs, and feedback help me create better software which allows all of us to create better portfolios. So, thank you for all the contributions, ideas, sound boards, etc.

Edge Does Not Have to be Big

Renaissance searched for “overlooked” edges and joked about a 50.75%-win rate while utilizing the law of large numbers to win in the long-run. Seeking the perfect entry or exit or the one strategy is often a failed approach. Ren Tech generated astronomical returns with a nearly 50%-win rate. Much more can be gained combining unique smaller edges together than wasting time hunting for the holy grail.
Some of the trading signals they identified weren’t especially novel or sophisticated. But many traders had ignored them. (Page 112)
“We’re right 50.75 percent of the time… but we’re 100 percent right 50.75 percent of the time. You can make billions that way” (pg 272)

The Man Who Solved the Market – Gregory Zuckerman

Most of the quotes in this article are from this tremendous book. The book released in November 2019 and does such a great job covering Simons. Simons and Renaissance are very secretive about their strategies but there are a few insights (if you read between the lines) in the book.
Jim Simons - The Man Who Solved the Markets Book

Jim Simons Interviews and Videos

James Simons Full Length Numberphile Interview

The Mathematician who cracked Wall Street

James Simons – Mathematics, Common Sense and Good Luck

Famous Jim Simons Quotes

These quotes come from Zuckerman’s book along with page number. You can read into the lines and see why Simons is such a staunch supporter of the systematic trading approach.
Early on, he traded like others, relying on intuition and instinct, but the ups and downs left Simons sick to his stomach. (Page 2)
Simons and his colleagues used mathematics to determine the set of states best fitting the observed pricing data; their model then made its bets accordingly. The why’s didn’t matter, Simons and his colleagues seemed to suggest, just the strategies to take advantage of the inferred states. (Page 29)
“I don’t want to have to worry about the market every minute. I want models that will make money while I sleep”, Simons said. “A pure system without humans interfering.” (Page 56)
If a currency went down three days in a row, what were the odds of it going down a fourth day? Do gold prices lead silver prices? Might wheat prices predict gold and other commodity prices? Simons even explored whether natural phenomena affected prices. (Page 57)
Their goal remained the same: scrutinize historic price information to discover sequences that might repeat, under the assumption that investors will exhibit similar behavior in the future. Simon’s team viewed the approach as sharing some similarities with technical trading. The Wall Street establishment generally viewed this type of trading as something of a dark art, but Berlekamp and his colleagues were convinced it could work, if done in a sophisticated and scientific manner – but only if their trading focused on short-term shifts rather than longer-term trends. (Page 108)
Berlekamp also argued that buying and selling infrequently magnifies the consequences of each move. Mess up a couple of times, and your portfolio could be doomed. Make a lot of trades, however, and each individual move is less important, reducing a portfolio’s overall risk. (Page 108)
Humans are most predictable in times of high stress – they act instinctively and panic. Our entire premise was that human actors will react the way humans did in the past….we learned to take advantage.” (Page 153)
“Any time you hear financial experts talking about how the market went up because of such and such – remember it’s all nonsense”, Brown later would say. (Page 199)
By 1997, though, more than half of the trading signals Simon’s team was discovering were nonintuitive, or those they couldn’t fully understand. (Page 203)
“If there were signals that made a lot of sense that were very strong, they would have long-ago been traded out”, Brown explained. “There are signals that you can’t understand, but they’re there, and they can be relatively strong.” (Page 204)
The gains on each trade were never huge, and the fund only got it right a bit more than half the time, but that was more than enough. (Page 272)
his larger point was that Renaissance enjoyed a slight advantage in it collection of thousands of simultaneous trades, one that was large and consistent enough to make an enormous fortune. (Page 272)
The inefficiencies are so complex they are, in a sense, hidden in the markets in code,” a staffer says. “RenTec decrypts them. we find them across time, across risk factors, across sectors and industries.” (Page 273)
For all the unique data, computer firepower, special talent, and trading and risk-management expertise Renaissance has gathered, the firm only profits on barely more than 50 percent of its trades, a sign of how challenging it is to try to beat the market (Page 317)

Sources

Thanks for reading,

Author

David Bergstrom – the guy behind Build Alpha. I have spent a decade-plus in the professional trading world working as a market maker and quantitative strategy developer at a high frequency trading firm with a Chicago Mercantile Exchange (CME) seat, consulting for Hedge Funds, Commodity Trading Advisors (CTAs), Family Offices and Registered Investment Advisors (RIAs). I am a self-taught programmer utilizing C++, C# and python with a statistics background specializing in data science, machine learning and trading strategy development. I have been featured on Chatwithtraders.com, Bettersystemtrader.com, Desiretotrade.com, Quantocracy, Traderlife.com, Seeitmarket.com, Benzinga, TradeStation, NinjaTrader and more. Most of my experience has led me to a series of repeatable processes to find, create, test and implement algorithmic trading ideas in a robust manner. Build Alpha is the culmination of this process from start to finish. Please reach out to me directly at any time.

To skip down to the best automated trading strategies click here.

What is an automated trading system?

An automated trading system is a set of rules that can be programmed for a computer to automatically execute trades whenever the rules occur in a given financial market. An automated trading system is the same thing as an automated trading strategy, an algo strategy, a trading algorithm, a trading robot or an algorithmic trading strategy.
In short, any pre-determined set of buy and sell rules that can execute trades automatically can be considered an automated trading system. Trading rules can be any set of if then scenarios and do not need to be complicated mathematical models.

Simple Automated Trading System Example

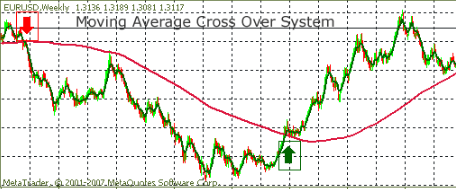
The simplest automated trading strategy is a moving average cross strategy. This system buys when the stock price rises above the moving average and sells when the stock price falls below the moving average.
Algorithmic traders have long known this strategy to lose its luster in financial markets, but this system is a great example of how simple buy or sell decisions can be made using technical indicators or market prices. If you can think it, then it can be coded.
Later we will get into much more complex algorithmic trading strategies and trading algorithms. However, I will not go into black box trading where strategies are known to the computer but not known to the human in charge of the computer.

How Does Algorithmic Trading Work?

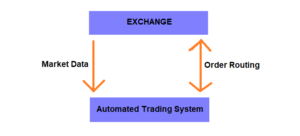
Algorithmic trading works over the internet allowing one computer or server to receive market data and send trading instructions to another computer or server. For instance, a high frequency trading firm may have their servers co-located in the exchange’s data center. This allows for lower latency in receiving new market prices and issuing new orders.
This server can also calculate the trading strategies and send buy and sell orders directly to the exchange. The exchange parses the message and executes the market makers’ desired actions.
Most trading systems communicate with the exchange through Financial Information Exchange protocol or FIX protocol. However, many independent traders have brokers that provide this communication connection built into the platform and most traders never have to worry about how algorithmic trading works.
Most platforms, brokers, and software provide application programming interfaces or APIs that make it easy to connect custom code to the exchange or broker. However, software like Build Alpha or TradeStation make it possible to connect directly with data providers, brokers, and the exchanges so traders only have to worry about entries, exits and risk management.

What are different types of automated trading systems?

There are various different types of trading strategies but let’s cover the five most popular strategies below. These strategies can apply for longer term investors or day traders. For a more extensive look please check out my Algorithmic Trading Guide.

Momentum or Trend Following

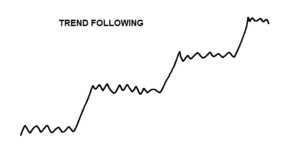
Arguably the simplest and most widely used – especially amongst commodity traders. Trend following strategies aim to capture prolonged price movement in a single direction or a “trend”.
Trend strategies tend to have lower win percentages as these strategies have outsized winners in comparison to more frequent but smaller losers. The typical returns from a trend strategy may be a series of small losses and then one large win when the system captures the large trend move.
These strategies are best implemented by traders with strong resolve and the ability to withstand frequent losses. Periods of chop and noise are much more common than big trend moves thus leading to your trading account not making much progress most of the time and then making large leaps “at once”.

Mean Reversion

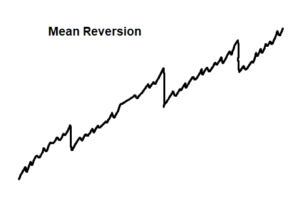
Mean reversion trading strategies tend to have higher win percentages as they have many frequent small wins and the infrequent large loss. The typical returns from a mean reversion strategy may be a series of small wins and then one large loss when the trend breaks.
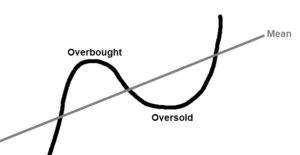
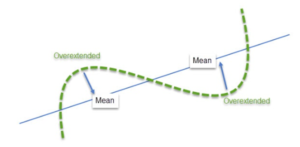
The simplest mean reversion strategy is one that aims to buy and sell large deviations from a moving average or volume weighted average price. As price moves away from the mean, however calculated, the strategy looks to enter a position with the intention of price returning to the average price.
Many traders refer to these extremes as overbought or oversold and attempt to quantify them with technical analysis, technical indicators, mathematical models or statistical concepts.
In theory, traders that employ mean reversion strategies can experience profit and loss of their trading account to inch higher most of the time with periodic large set backs. Many market makers and dealers experience this.

Statistical Arbitrage

Typically, statistical arbitrage is looking for short-lived opportunities between two securities. Many traders will isolate two correlated or related stocks such as Coca-Cola and Pepsi and monitor the spread or difference between the two. Whenever the difference between the two becomes large enough the trader places a trade buying the cheaper and shorting the expensive until the pairing comes back into normal ranges.
An obvious simplification, but many traders cannot execute pair trading or statistical arbitrage with retail brokerage accounts and software. There is also steep competition from professionals, market makers and hedge funds.

Market Making and High Frequency Trading

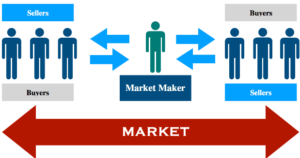
A market maker can be thought of as a liquidity provider that quotes both bids and offers regardless of market conditions. The market maker will hold inventory and aims to profit on the bid-ask spread or the difference between the highest price someone is willing to buy and the lowest price someone is willing to sell.
Market making is arguably the most complex form of algorithmic trading and automated trading as it requires tons of price data, quote information, data from multiple stock exchanges, active trading activities and trading decisions and is often completely automated with zero room for discretion.
High frequency trading (HFT) is market making or trading in fractions of a second based on powerful computer programs executing large numbers of orders almost simultaneously. The depths, pros and cons, and nuances of HFT and market making far exceed the scope of this post.

Pattern Trading

In the previously mentioned Algorithmic Trading Guide, I mention pattern trading as being one of the most common strategy types for algorithmic traders. This style was popularized by Jaffray Woodriff of Quantitative Investment Management in Jack Schwager’s Hedge Fund Market Wizards book (still one of my favorites).
This style looks for repeatable patterns that shift the odds one way or the other. For example, based on historical data, whenever this candlestick formation or these two events have occurred there has been a X% chance price is higher over the next N days. Again, a gross simplification, but a trading style most traders are familiar.

Is Automated Trading Profitable?

Yes. The leading 12 investment banks earned about $2 billion from portfolio and algorithmic trading in 2020 according to Coalition Greenwich. Additionally, the greatest hedge fund of all time – Renaissance Technologies – is strictly algorithmic. Listen to James Simons, the founder, speak from 36:48 to 38:00.
Furthermore, I have posted tons of algo trading success stories on the Build Alpha blog. Successful automated trading requires rigorous testing, robustness tests, stress testing, considering multiple market conditions, contextual data and more. Nothing manual trading does not require. I wrote a bit about strategy reliability here: Robustness Testing for Trading Strategies.

Can I automate my trading strategy?

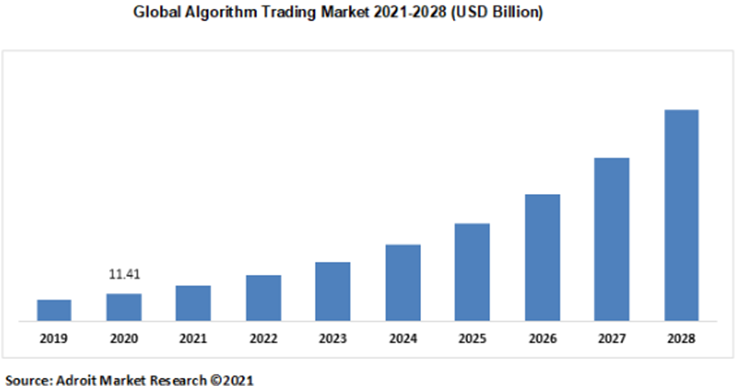
Yes. We live in the golden age of algo trading as nearly 75% of US equity volume now comes from algorithms while algorithmic trading is expected to grow at 11.23% CAGR over the next five years. Brokers and data platforms have made trade automation incredibly simple.
My goal with Build Alpha has been to connect those with a desire to automate trading strategies with the tools to do so without having to learn or write any code. Now anyone can test, build and automate their trading strategies without any code.

What’s the best automated trading software?

Build Alpha is the best automated trading software. I am biased because as I set out to find the best automated trading software, I could not find one that gave me the end-to-end tools necessary. That is what prompted Build Alpha’s development oh so many years ago. That being said, I will review the three most popular software for automated trading strategies.

Build Alpha

Build Alpha enables traders to create, test, and automate trading strategies with no code. There are 5,000+ built-in entry and exit signals as well as the ability for users to add their own signals with a drag and drop builder. The signal library includes everything from seasonality, price action, candlesticks, chart patterns, technical indicators, market breadth, options flows, economic data, time of day and more.
Build Alpha works in two ways. First, the trader can select specific entry and exit signals from the point-and-click interface to test a specific strategy. On the other hand, Build Alpha’s genetic algorithm can take thousands of inputs such as potential entries, exits, filters, risk management, position sizing, account size and will build the best possible strategies.
The trader can also specify certain thresholds that each strategy must pass such as the Monte Carlo simulation must be profitable or the profit factor must be above 1.7, etc. These automated workflows allow for the fast creation of strategies that fit any trader’s desired risk tolerance and performance thresholds.
Build Alpha then connects to live market prices for real-time strategy monitoring or can produce fully automatable code for every strategy. This code can be copy and pasted into various broker platforms for live trading.
Take a look at these to see step-by-step walkthroughs

TradeStation

TradeStation makes automating trading strategies very simple as TradeStation is a broker and has a really reliable platform which is a favorite among independent algorithmic traders. TradeStation also created Easy Language, a proprietary programming language aimed to make trading strategy development much simpler for traders.
Traders can write their strategy logic using Easy Language inside TradeStation’s Development Environment. Once the strategy’s code is complete, the trader can easily add the strategy to a chart to enable simulated or live trading.
A simple moving average crossover strategy may only require two lines of code using Easy Language. Here is an example below:
If Close crosses above average(close,10) then buy 100 shares next bar open;
If Close crosses below average(close,10) then sell 100 shares next bar open;
For those of you interested in a TradeStation account, email me to find out how TradeStation will pay for your Build Alpha license.

Python

Python is undoubtedly the fastest growing programming language due to its easy-to-read syntax and clean scripting style. Many traders have flocked to python as the vast number of public libraries that have already built trading functionality such as technical indicators and other position sizing logic coded continues to grow.
If you are interested in learning about using python to build automated trading strategies, then I highly recommend checking out a few other resources I have created.

How to create a trading algorithm in 3 Steps with Build Alpha

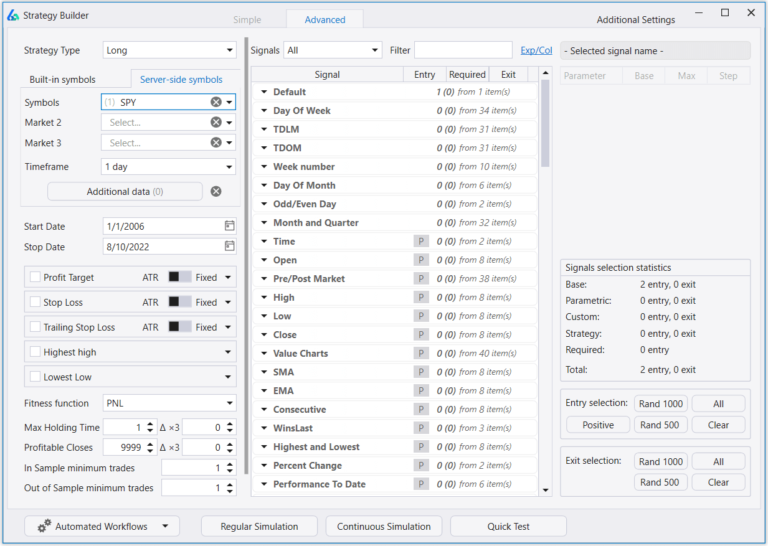
Build Alpha is the simplest way to create algorithmic trading strategies as it does not require any coding. Let’s take the moving average cross strategy above and build it in 3 clicks.

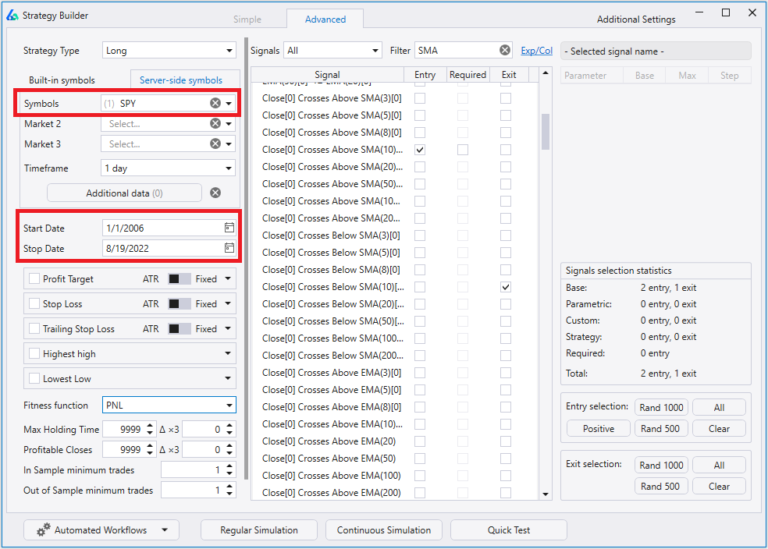
Step 1 – Select Signals

Search for SMA signals and select an entry and exit. Let’s enter when the close crosses above the 10-period SMA and exit when the close crosses above the 10-period SMA.
Yes, you can optimize parameters. I am showing the lazy hardcoded settings. Traders can create any range of parameters to test and optimize.

Step 2 – Select Dates and Symbol(s)

Select your test dates, symbol(s), and any risk management. I will select SPY and test from 2006 to 2022.

Step 3 – Simulate

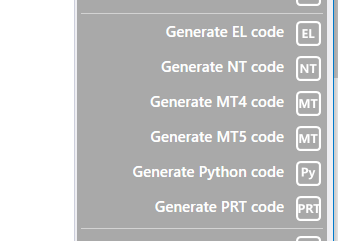
Hit Simulate and view your results. If the results are suitable (they should not be) then hit one of the “Generate Code” buttons to get fully automatable code for this (or any) strategy.
It is important to note that Build Alpha permits automated trading strategy monitoring in two ways. First, you can export generated code. Second, you can connect your broker’s data feed with existing connections to TradeStation, Interactive Brokers, QuoteMedia, Binance, and more.

Example Automated Trading Strategy

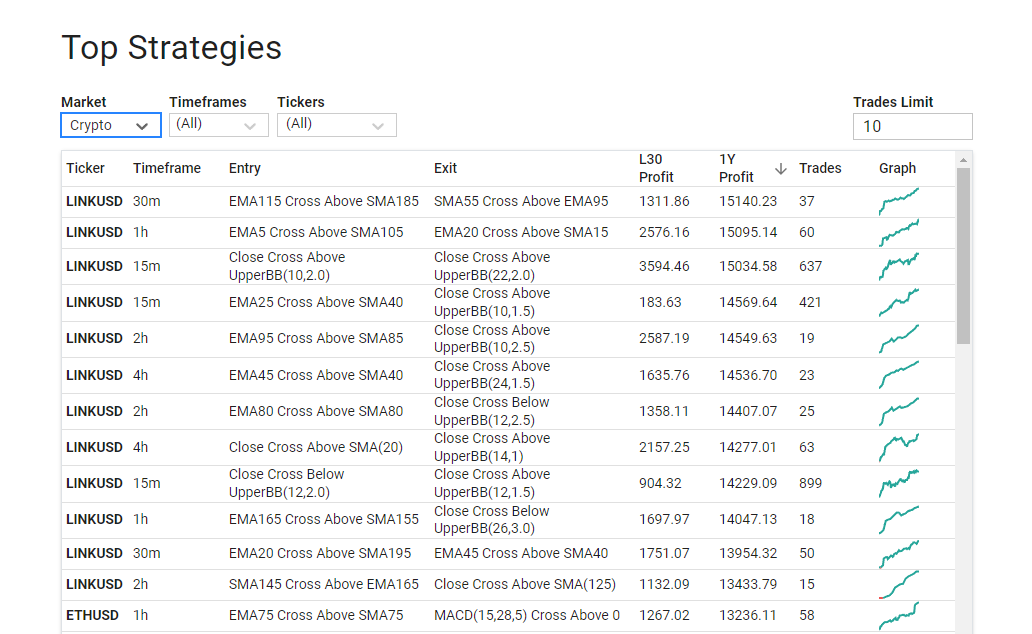
Later in this post I will share a table that automatically updates with the best technical analysis strategies for all financial markets. Each strategy uses one rule for entry and one rule for exit. These are meant to give insights to what is working now, building blocks for your own strategies, and general free information.
This strategy below has two rules: one for entry and one for exit. The trading strategy is applied to CSCO or Cisco Systems Inc which is a large multinational technology conglomerate.
This strategy enters when the closing price crosses below the 5-period exponential moving average (EMA) and exits when the closing price crosses above the 5-period exponential moving average.
At the time of publishing, you can see a sample of this strategy’s performance on the far right over the past 1,809 trades earning $18,138.17 per 100 shares traded over the last 12 months. This strategy also would have made $1,883.81 over the last 30 days.

What are the best automated trading strategies right now?

First, how do we define best? The simplest way is total P&L. Second, what is a trading strategy? In this case, let’s look at all possible combinations of technical indicators and only use one rule for entry and one rule for exit.
Can we build more advanced systems? Yes. However, this results table serves to show us what parameter settings, lookback ranges and indicators have been performing well lately. Perhaps this info can serve as building blocks for new automated trading strategies or just free information for my fellow system traders
In the table below, you can sort by asset class, timeframe, ticker, and minimum trade count. All strategies are sorted by their total profit and loss over the last 30 days and last 12 months. All strategies use the same position sizing.

Key Points

  • Automated trading systems automatically execute buy and sell orders based on pre-defined rules.
  • There are at least 5 different types of algorithmic trading strategies
    1. Trend Following
    2. Mean Reversion
    3. Statistical Arbitrage
    4. Market Making / High Frequency Trading
    5. Pattern Trading
  • It has never been easier to automate trading strategies – even with no programming
  • Build Alpha, TradeStation and Python are easier routes to algo trading
  • The best trading strategies are changing all the time, but the table above is free to all

Summary

Automated trading strategies continue to grow in popularity as traders with no programming background can now turn their strategies into trading algorithms. Automated trading strategies are just pre-defined rules that instruct a computer when and how much to buy and sell in financial markets. I have spent the past decade involved in professional trading and can honestly answer there is no best automated trading strategy. However, a combination of robustness testing and portfolio construction can help any trader gain an edge in algorithmic trading over the trader that fails to grasp these algorithmic trading concepts.

Author

David Bergstrom – the guy behind Build Alpha. I have spent a decade-plus in the professional trading world working as a market maker and quantitative strategy developer at a high frequency trading firm with a Chicago Mercantile Exchange (CME) seat, consulting for Hedge Funds, Commodity Trading Advisors (CTAs), Family Offices and Registered Investment Advisors (RIAs). I am a self-taught programmer utilizing C++, C# and python with a statistics background specializing in data science, machine learning and trading strategy development. I have been featured on Chatwithtraders.com, Bettersystemtrader.com, Desiretotrade.com, Quantocracy, Traderlife.com, Seeitmarket.com, Benzinga, TradeStation, NinjaTrader and more. Most of my experience has led me to a series of repeatable processes to find, create, test and implement algorithmic trading ideas in a robust manner. Build Alpha is the culmination of this process from start to finish. Please reach out to me directly at any time.

Can you automate your trading?

Yes, you can automate your trading! In fact, according to BusinessWire, algorithmic trading is responsible for 60-73% of all U.S. equity trading. Most brokers support automated trading and even provide easy to learn programming languages to build your first automated trading system.

Three Ways to Automate Your Trading

Most broker platforms support automated trading with two options for automation. Build Alpha provides a third.
Both of the first two solutions require tedious hours learning to code, intricacies of the platform’s development environment or API, and introduces fragile breakpoints that can harm your trading results if you are not an experienced programmer.
Later in this article, I will introduce how you can still automate your trading with no coding using Build Alpha and a variety of popular brokers. The benefits of automated trading are still possible without the ability to program!

Is Automated Trading Profitable?

Absolutely. Automated trading is simply having a computer execute trades instead of you manually clicking the mouse buttons. The largest banks, hedge funds, and the best trader of all time are staunch supporters and users of automated trading.
I also highlighted several Build Alpha success stories (with statements) in my Algorithmic Trading Guide.
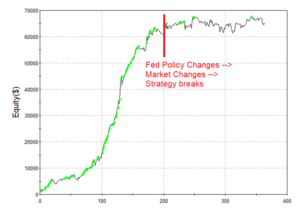
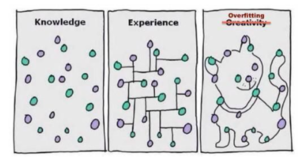
Many fear automated trading is not profitable because they fall for snake oil salesmen selling overfit trading strategies that were not developed to last but developed to sell. Automated trading requires robustness testing or stress testing to break the strategy before the market does. I wrote more about Robustness Testing here.

What is an automated trading system?

An automated trading system is a set of pre-defined entry and exit rules executed by a computer program. Many proper trading systems contain risk management and position sizing as well.

Simple Moving Average Example

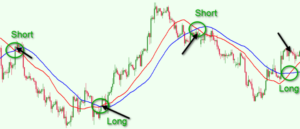
The simplest example of an automated trading system, and probably the most popular technical analysis system, is the moving average crossover. In the moving average crossover system, a trading system would enter a long position when the faster moving average (shorter length) crosses above the slower moving average (longer length). The system would exit a long position when the faster moving average crosses below the slower moving average.

How do I automate my trading with no coding?

Build Alpha is no code algo trading software that allows traders to create hundreds of algorithmic trading strategies on historical data at the click of a button. No algo trading experience needed.
There are thousands of built-in entry and exit signals to choose from and the ability to create your own with a drag and drop builder or using python. The built-in library covers everything from
Simply search and select your desired entry signals, exit signals, risk management and position sizing then hit simulate and Build Alpha will generate the best results.
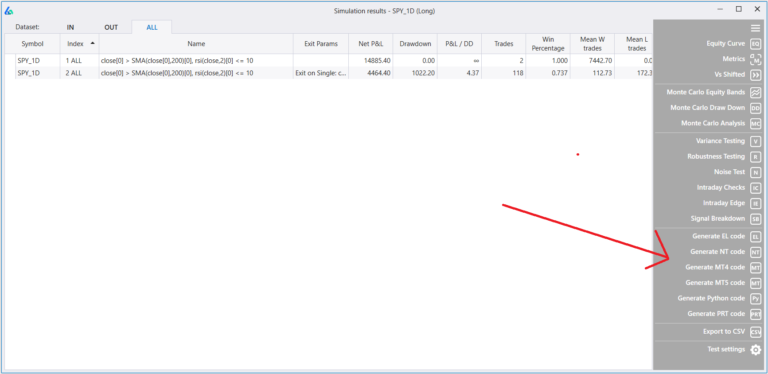
From the results window, select your desired trading system then click on one of the code generators in the lower right. The code generator will produce fully automatable code that can be copy and pasted into any of the supported broker platforms.

Code Generators Supported

No Code Algo Trading Strategy Example

Step 1 – Determine the Strategy

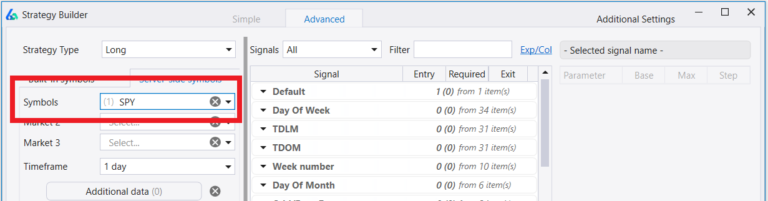
Let’s build the famous 2-period RSI strategy from Larry Conners’ book Short Term Trading Strategies that Work on SPDR S&P500 ETF SPY.
This strategy enters when the 2-period RSI is below 10 and price is above the 200-period simple moving average. On the other hand, this strategy sells when price is above the 5-period simple moving average.

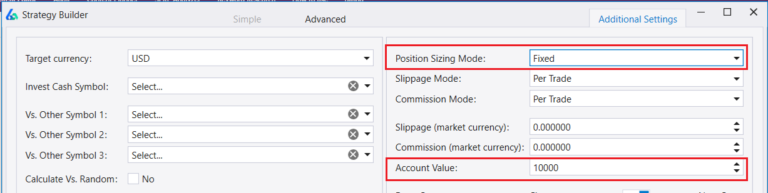
Step 2 – Set account size and position sizing

We will use a fixed size of $10,000 per position. We achieve this by setting the account size to $10,000 and the position sizing to Fixed. Both are found in the settings menu.

Step 3 – Select Symbol(s)

Next, we need to select our symbol as SPY.

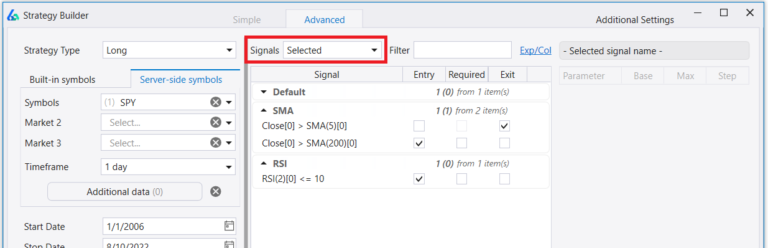
Step 4 – Select Entry and Exit rules

Finally, let’s select our trading decisions or entry and exit rules. The entry requires the following two conditions to be true
Alternatively, the exit signal closes the trade when price is above the 5-day moving average.
Here is a quick gif searching and selecting the following entry and exit signals in Build Alpha.
Click on the gif to view/watch
Now that we see our results, we can highlight the strategy, review its performance metrics and equity curve, and ultimately generate code for it.

Step 5 – Generate Code

In the results window, highlight your strategy and navigate over to the lower right where you will find the Generate Code buttons. Find your preferred broker platform and hit Generate.
The Generate Code button will create complete code for the highlighted strategy that can be copy and pasted into your broker’s platform. Voila! Automated trading with no coding necessary. Steps for each broker below.

How do I set up my automated trading with Generated Code? Best Automated Trading Platforms

Great! How do we take the generated code and start auto trading buy and sell orders? Let’s walk through how you can take the generated code and set it up in the three most popular automated trading platforms.

TradeStation – Automated Trading Platform

TradeStation is arguably the consensus favorite among automated trading platforms. It is very easy to use, reliable and has competitive fees. Now you can partake in TradeStation algorithmic trading without being a tradestation coder.

Step 1 – Open Development Environment

The first step to automating with TradeStation is to open the Development Environment found under View >> Development Environment.

Step 2 – Create new strategy File

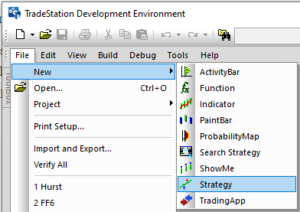
Next, create a new strategy File >> New >> Strategy

Step 3 – Copy and Paste

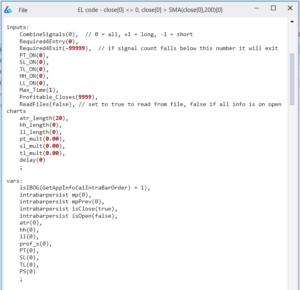
Then copy and paste the Build Alpha generated code into the new Strategy and hit F3 to verify. You can hit CTRL+A to highlight all the Build Alpha generated code then CTRL+C to copy it all. Then inside the new Strategy in TradeStation’s Development Environment you can hit CTRL+V to paste it all.

Step 4 – Add to Chart

Finally, open a new chart and set it with the symbol you wish to trade. Then right-click and select Insert Strategy!
Here is a 1-minute (no sound) YouTube video showing this exact process: Build Alpha code to TradeStation
Please note this is an older version of Build Alpha’s results window. There are many more features now!
As part of TradeStation’s confidence in the software, we have partnered to help traders have the best of both worlds. If you open a new TradeStation account and license Build Alpha then TradeStation offers a commission rebate plan to repay you until they have paid for your license. For more information, please check out TradeStation Build Alpha promo.

NinjaTrader – Automated Trading Platform

NinjaTrader8 is a close second and highly favored automated trading platform among futures traders. Below are four simple steps to take Build Alpha generated code and enable inside NinjaTrader8. That’s right, you can generate and trade NT8 scripts without being a ninjatrader coder.

Step 1 – Open Script Editor

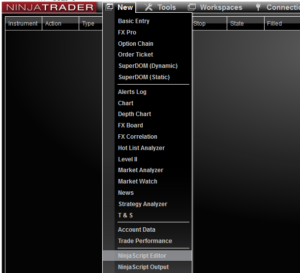
Open up the NinjaScript Editor

Step 2 – Create new strategy file

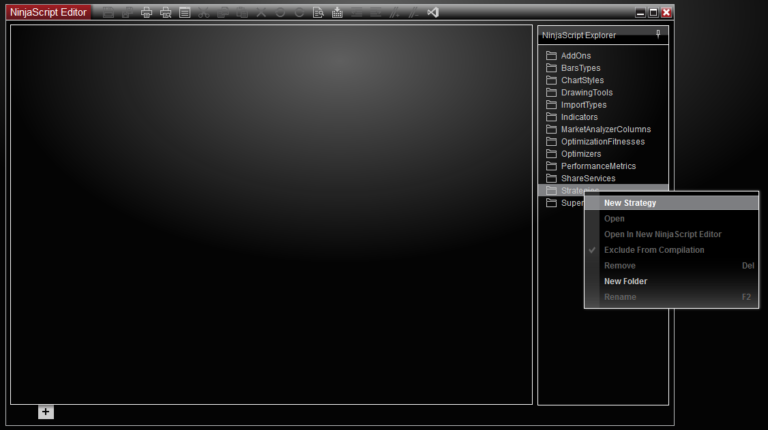
In the NinjaScript Editor, right-click on Strategies to create a new one.

Step 3 – Name your strategy

Name your strategy and hit Generate.

Step 4 – Copy and Paste

In the new NinjaTrader Strategy that appears, please hit CTRL+A to highlight all text and then hit ‘BACKSPACE’ to delete it all. Then inside Build Alpha, hit Generate NT Code. Please highlight and copy all the generated code using CTRL+A, CTRL+C. Then come back to the blank NinjaTrader Strategy and hit CTRL+V to paste it all.

Step 5 – Quick Edit

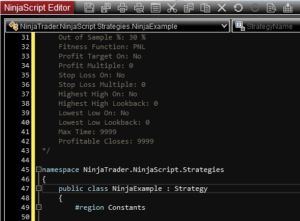
Go to line 47 and edit the class name to be the same as the designated strategy name. You can go to line 47 by hitting CTRL+G then entering 47. I named the strategy NinjaExample.
After making this change you can verify or compile the strategy by hitting the above button.

Step 6 – Add to Chart

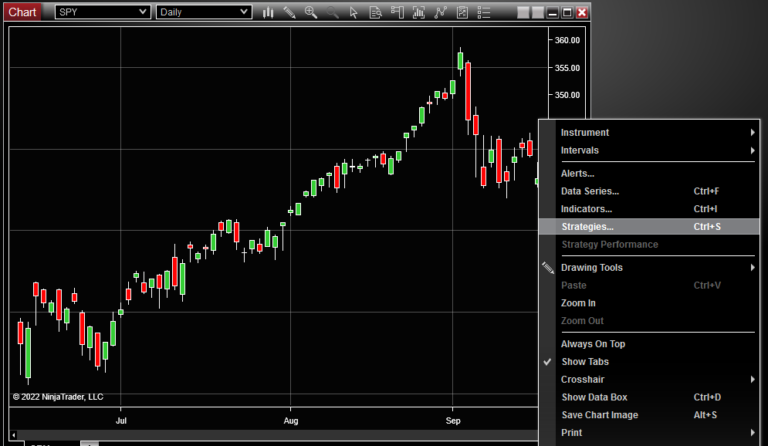
Open up your desired chart, right-click and select Strategies. Alternatively, you can hit CTRL+S.

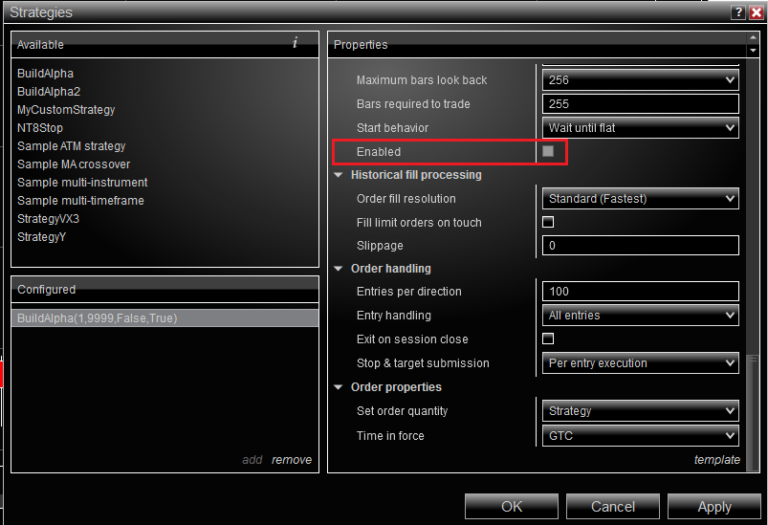
Step 7 – Enable

Select your strategy and be sure to enable the strategy in the Properties pane.
That’s a wrap. Ninjatrader automated trading systems without writing a single line of code in your ninjatrader scripts.

MetaTrader4 and MetaTrader5 – Automated Trading Platforms

MetaTrader4 and MetaTrader5 are both supported by Build Alpha’s code generators. However, most traders should migrate to MetaTrader5. In a recent Build Alpha survey, MetaTrader was the lowest ranked automated trading platform among the three listed in this article. I highly encourage you to check out the other two if you are currently struggling with MetaTrader.

Step 1 – Open MetaEditor

Open MetaEditor. This can often be done from your search menu or from within MetaTrader.

Step 2 – Create new EA

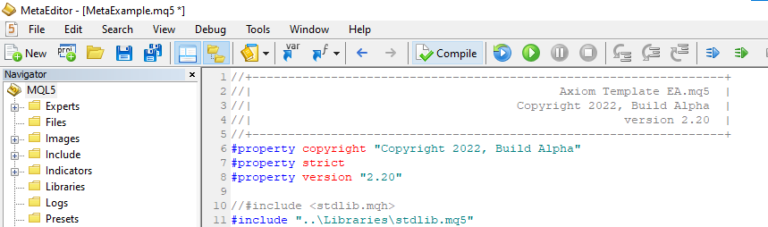
Create a New Expert Advisor. Expert Advisors are what MetaTrader calls strategies. Give your expert advisor any name you desire. I will use MetaExample.

Step 3 – Copy and Paste

In the new strategy that appears, please highlight and delete all text. You can hit CTRL+A and ‘BACKSPACE’ as we have done before.
In Build Alpha, hit the Generate MT4 Code or Generate MT5 Code button. Then highlight and copy all the text. This can be done using CTRL+A, CTRL+C. Back in the MetaEditor, paste all the generated code using CTRL+V. Then hit the Compile button in the top menu.

Step 4 – Add to Chart

You can now add expert advisors to the tester or a live chart.

Can I automate my day trading?

Absolutely. Build Alpha has time frame selection, time of day filters, and a Force End of Day Exit option that forces any strategy to close open positions at the specified time.
The pre- and post-market signals allow traders to specify signals around volume weighted average price (VWAP), pre- and post-market volume or pre- and post-market highs and lows.
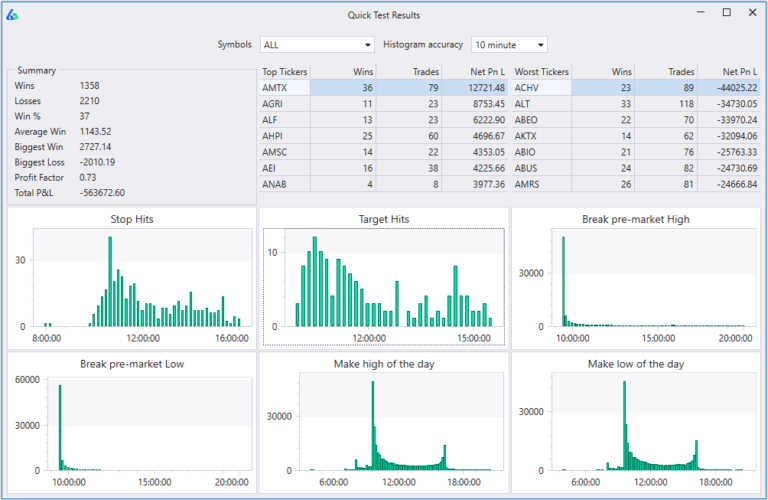
The Quick Test feature even allows you to test a strategy across thousands of symbols and view the optimal times to take profits, stop out, or when highs and lows of the day are made. The test even shows you most profitable and least profitable symbols as well as a summary across all tickers.
Please note it is best that day traders do not use excessive leverage or size as there is a high risk of losing money rapidly due to leverage.

Automated Trading Pros

What are the benefits of automated trading?

More Markets

Market data moves so quickly, and manual trading can rarely keep up. There are often missed trades during fast moving market conditions. Automated strategies can be one of many trading solutions to help.
Trading more markets, more systems can often mean getting to the law of large numbers faster. If your systems have edge, then this means a rising account.

Quantified Risk

Experienced traders know that having a set of rules with a risk you can afford to take is the key to financial longevity. New traders seeking massive upside often take the high risk and lose money because they do not have a system or have properly quantified their trading edge.

Computer Never Sleeps

Certain financial markets like futures, forex and cryptocurrencies trade 24 hours per day. There are tons of trading account opportunities in off market hours and auto trading and automated trading strategies can help.

Fewer Mistakes

Trading is hard. Losing your money sucks. Losing your money from human errors like fat fingering an order or entering the wrong symbol suck even more.
Automated systems help avoid these blunders. Consider whether you understand how big of an impact this can have on your emotional state. No more calling customer support to see if they will cancel a trade.

Less Emotions

Backtesting trading strategies and understanding how a system can make money or lose money over the next N trades is crucial to reducing emotions. If you have a plan, you can stick to it.
If you do not have a plan, then losing your money heightens stress, which heightens emotions, which raises your probabilities to harm your trading account.

Known Systems

Automated trading is much more than automatic order entry. Advanced trading work is understanding edge, setting proper expectations, and quantifying your risk. Many investors do not know their systems and cannot properly answer these above questions. How do you think these traders wind up?

Automated Trading Cons

Where to Start with Automated Trading?

There are so many markets, symbol, timeframes and potential signal combinations. New traders often do not know how to start. The simplest solution is to start quantifying what you do know. For example, does price need to be above a moving average? What moving average? Does yesterday need to be a bullish or bearish day? What about volume?
I wrote here about quantifying simple ideas:
Solution: Build Alpha does not require you to have a trading idea. You can of course test your own ideas, but if you do not have an idea you can select thousands of input signals at once and Build Alpha will find the best strategies for you. The genetic algorithm learns from your inputs and creates the best combinations quickly.

Computer needs to be on 24 hours?

Yes, if your computer is not connected to the internet or turned off then the automated trading systems will not send orders to the broker’s trading platform.
Solution: Rent a virtual private server (VPS) which is a computer that is on 24-7 which you can remotely log into. Amazon, Microsoft and other smaller companies have been reliably offering this service for years and often you can rent a VPS for only a few bucks per month. All PCs have remote monitoring software built-in.

What if my trading signal is not included in the built-in signals?

There are nearly 5,000-plus signals built-in, and I have done my very best to include those with above average e-ratios, but it is possible that your trading idea requires something unique.
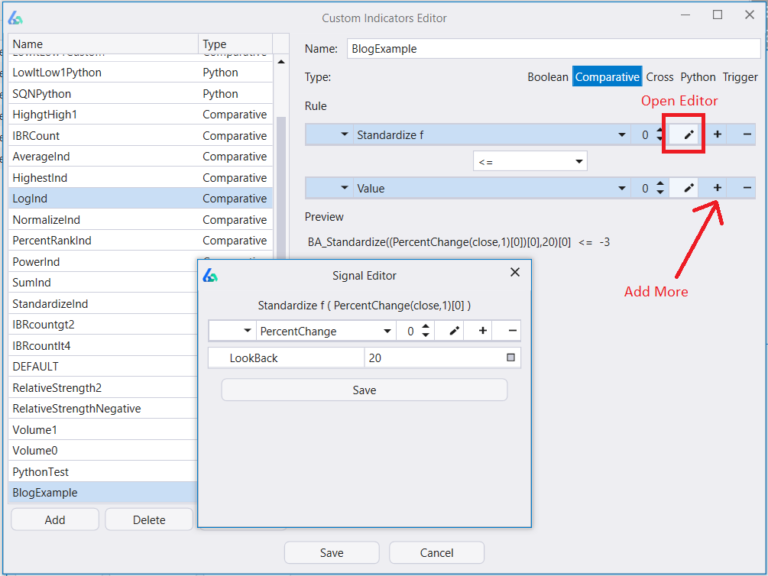
Solution: Build Alpha has two ways to add custom signals that can be passed to the strategy builder engine. First, there is a drag and drop signal builder. It allows the trader to combine any technical indicator, math operator, and custom parameter setting.
Second, there is the ability to add custom signals with python for those with the abilities.

Need to Know

Summary

Automated trading is growing every year with now nearly three quarters of U.S. stock market volume being attributed to automated trading. In the past, creating automated trading systems required access to historical market data, live market data, broker connections, and the ability to program it all. However, now, Build Alpha provides professional automated trading software to all traders. This enables all traders to create, test, and automate any trading strategy on a variety of automated trading platforms.
Automated trading platforms support both demo account and live account implementations. Cryptocurrencies, Forex, CFDS are complex instruments and come with a steeper learning curve and intricate nuances, but traders can focus on futures, stocks and ETFs as all markets are automatable.

Author

David Bergstrom – the guy behind Build Alpha. I have spent a decade-plus in the professional trading world working as a market maker and quantitative strategy developer at a high frequency trading firm with a Chicago Mercantile Exchange (CME) seat, consulting for Hedge Funds, Commodity Trading Advisors (CTAs), Family Offices and Registered Investment Advisors (RIAs). I am a self-taught programmer utilizing C++, C# and python with a statistics background specializing in data science, machine learning and trading strategy development. I have been featured on Chatwithtraders.com, Bettersystemtrader.com, Desiretotrade.com, Quantocracy, Traderlife.com, Seeitmarket.com, Benzinga, TradeStation, NinjaTrader and more. Most of my experience has led me to a series of repeatable processes to find, create, test and implement algorithmic trading ideas in a robust manner. Build Alpha is the culmination of this process from start to finish. Please reach out to me directly at any time.

What is a Stop Loss?

A stop loss is an order to close an existing position to limit losses when the market reaches a certain price. A stop loss is a form of risk management and intends to serve as protection from more severe trading or investing losses. The purpose of a stop loss is to automatically exit a trade when the trader cannot stomach more pain in the trade or the set up has been invalidated. Before we get into all the types and variations of stop losses including the trailing stop loss, let’s become masters of understanding stop losses as a money management tool.

How Does a Stop Loss work?

A simple stop loss example is Cody buys 100 shares of Apple stock at a purchase price of $104.00 to open a long position (aiming to profit from a rise in AAPL stock). Cody does not want to risk more than $200 on his trade.
If AAPL’s price falls to $102.00 then Cody’s 100 shares would result in a $200 loss. Cody can set a stop loss order at $102.00 so that if and when AAPL falls to $102.00 his shares will be automatically sold.
When the market price reaches the stop price, the stop-loss order is converted to a market order and is generally executed immediately thereafter assuming during market hours. It is important to note that the market’s liquidity will determine the actual fill price of the stop loss order after conversion to a market order.
If there is a buyer bidding to buy at least 100 shares at $102.00 then Cody’s stop loss order will sell to that buyer at that share price thus closing his position for a $200 loss.
However, if the best bid for 100 shares is at a lower price of $101.98 then Cody’s stop market order to sell will be executed at a stock price $0.02 below his stop level resulting in a loss of $202. This is because the stop loss order converters to a market order and takes the available current market price.

Market Price or Limit Price? What is the difference between a Stop Loss and a Stop Limit Order?

In the example above, the best bid could have been $101.08 instead of $101.98 and when price falls below the stop and the next available market price is significantly below the trader’s desired exit level then significant losses may ensue.
What if in this scenario Cody would prefer to hold the position and wait for the share price rises or current price to recover before selling?
The stop limit order allows the trader to enter a stop price and a limit price which converts the stop order into a limit order (instead of a market order) after the stop price has been hit. Then the trade will be executed at the limit price (or better). This could alleviate some of the concerns around market orders.
Let’s revisit Cody’s position from earlier and assume he placed a stop limit order with a stop price of $102.0 and limit price $101.90. In the first example, Cody’s transaction price would be $101.98. In the second example, Cody’s stop would trigger but the limit order would never execute because price was already below his limit price ($101.08 vs $101.90). In this scenario, Cody would hold the shares and until the security price rebounds (hopefully).
The big difference is that a stop loss converts into a market order and a stop limit order converts into a limit order. The risk with stop limit orders are thinly traded markets or gaps beyond the stop limit. There are no stop limit orders guarantee to get filled at the specified limit price.

How to Calculate Stop Prices? Where to place them?

Method 1: beyond a recent high or low-price level

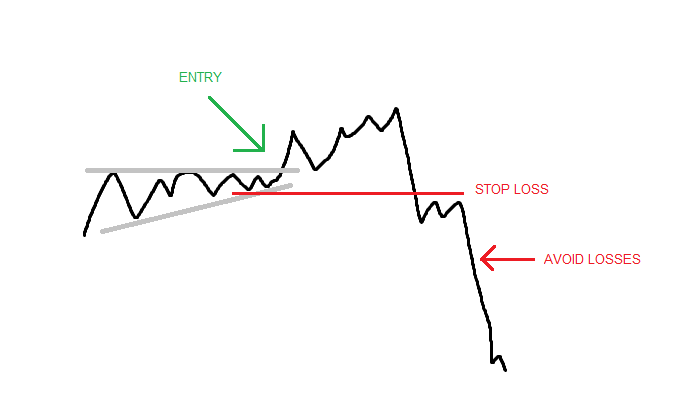
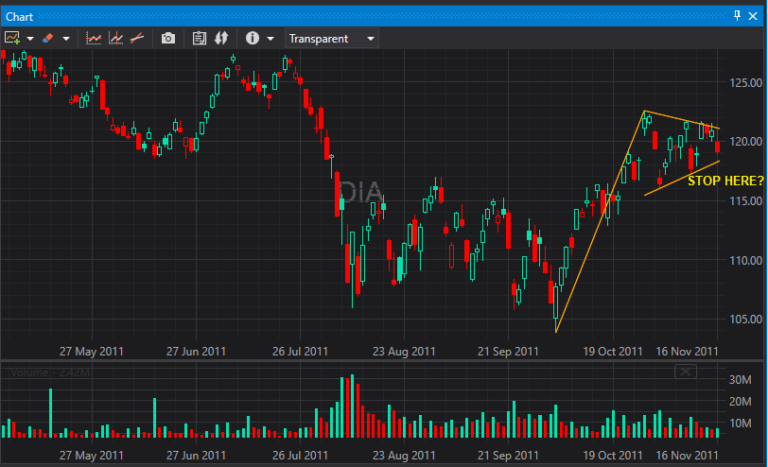
Those using technical analysis and chart patterns to trade will advise you to put a stop below (above) a recent low (high) that would invalidate the chart or pattern that prompted the entry.
However, one should not choose the minimum price below the most recent low but a decent margin below the recent price level so all the stock drops and natural volatile markets can happen without stopping you out of your position prematurely.
However, I have now spent years working with a high frequency trading, market making firm and I can assure you this is not a great strategy for existing positions especially in fast moving markets. We joke and call this the “draw a line stop loss”. This rings true for long and short positions and all trading hours.

Method 2: based on your risk tolerance

Another exit strategy to determining when to sell stocks on adverse price moves is to determine your entry, determine how much you are willing to lose and place your stop sell order at this amount. This may apply to traders that have pre-determined their position sizing based on the entry or their account size.
This strategy lacks forethought and traders must realize the market does not care where your pain threshold is. You may choose a price level that can be hit easily.

Method 3: something testable

Calculating stop loss orders is no different any other part of your trading system; that is, it should be fully testable. Often times using method one above does not result in something that can be backtested. Often times backtesting can result in isolating situations that produce more money or more favorable market conditions. This can also apply to placing sell stop or limit orders. Some easy ideas for something testable are:

What is a Trailing Stop Loss?

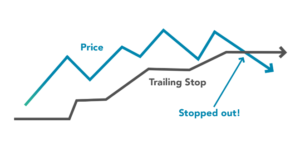
A trailing stop loss aims to protect profits moving the stop price higher as the market price moves higher. Trailing stops are often an excellent tool to protect gains and combat market volatility that wishes to shake you out of profitable positions. Of course, one can use either a trailing stop market order or a trailing stop limit order.
As the trading day progress and the trade becomes more profitable, the trailing stop can be updated instantaneously or at the end of each bar.

How to Calculate a Trailing Stop Loss?

Trailing stops are typically calculated from the maximum trade price or high watermark while in a long trade. Short positions just have reversed logic calculating from the minimum trade price during the trade.
Cody’s original transaction price was to enter a long trade at $104.00. Let’s assume Cody placed a $1 trailing stop which would initially start at $103.00 or $1.00 below his entry price. After the market opens, AAPL’s price shot up to $104.77 raising Cody’s trailing stop price to $103.77.
If trading fails to make a new high above $104.77 then Cody’s trailing stop would remain unchanged at $103.77. However, if the security price rises to a maximum price of $105.66 then Cody’s trailing stop would move to $104.66 which is above his entry price of $104.00. At this point, Cody has “locked” in some gains even if price drops. However, investing involves risk and anything can happen (look above to thinly traded or overnight gap risk comment).

What is the best Stop Loss strategy? Static or Dynamic?

Stop losses, stop limit orders, trailing stops, oh my. What are the best stop loss strategies to add to your trading systems? First, let’s discuss a few variations of what we have discussed so far.

Static vs Dynamic Stop Losses

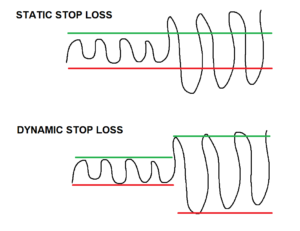
A static stop loss is a stop that is calculated the same way regardless of the current market price and market volatility. For example, a trader may employ a $200 stop for every trade he places regardless if the stock price significantly moves from the time of his first trade to the time of his most recent trade.
Static Stop Loss Pros
Static Stop Loss Cons
A dynamic stop loss is calculated based of the underlying price or market volatility. This allows the sell stop order to maintain an appropriate distance from the entry regardless of the market conditions. In periods of high volatility, the stop price will be farther from the stock price and in periods of low volatility the stop price will be closer to the stock price dynamically adjusting how “risky” the trade is.
Dynamic Stop Loss Pros
Dynamic Stop Loss Cons

Is a Stop Loss a good idea?

In some cases, a backtest may show a strategy perform better without a stop loss. This is much more common in mean reverting strategies as price tends to move farther away from the mean, the edge or advantage of entering (or holding) the trade actually may increase! A stop loss in this scenario could limit upside and increase what you pay in exchange commission and broker fees.
Here is a popular 2-period RSI strategy tested across common market ETFs SPY, DIA, QQQ, and IWM. The strategy buys when 2-RSI crosses above 20 and sells when 2-RSI crosses below 80.
The equity curve on the left shows using a fixed stop loss of 1% or $100 per trade assuming $10,000 per position. The equity curve on the right shows the same strategy with no stop logic! Neither strategy is great as a standalone but the version without a stop produced 2x the net profit in backtests.
On the other hand, trend following, or convex strategies almost always benefit from having a short leash for when a stock falls.

Position Sizing based on Stop Price

The late Dr. Van Tharp wrote extensively about calculating position size based on the distance between your entry point and your stop loss. Here is his complete guide: Van Tharp Position Sizing
In short, the trader determines what percentage of his account is acceptable to risk. Typically, this is set to 2%. Let’s assume Cody has $100,000 account so he is willing to risk 2% of $100,000 or $2,000 per trade. Cody has determined his stop loss order to sell be placed at $102.00 or $2.00 below his $104.00 price entry or the prevailing market price.
We can then calculate how many shares Cody should purchase by dividing the $2.00 distance by the $2,000 max risk allowance. This results in Cody buying 1,000 shares of AAPL.
This sizing method can really up the position sizing and traders should understand the risks that you may not get executed at a price level equal to the stop price level or $102.00 which can result in substantial or significant losses. Reminder about thinly traded markets and overnight gaps. Trading liquid futures contracts can help alleviate some of this concern.
Build Alpha algo trading software supports this method with its “Volatility” based position sizing method. This is method is both dynamic and sizes based on the stop loss distance.

What is the Best Stop Loss Strategy? Optimizing various Stop Losses on different trading strategies

Enough with the discussion, let’s look at some data. We can test some specific stop loss strategies and see which one performs the best using Build Alpha. First a quick overview of stop types.
For this test, we will choose three popular strategies, trade $10,000 per position, and backtest each strategy from 2006 to mid 2022. I will use the following stops in the test
The three automated trading strategies we will use are the following:
Here are the individual results sorted by strategy type
The $100 trailing stop was the best performer for both the RSI and Turnaround Tuesday strategy; however, it was one of the worst performers for the moving average crossover strategy!
This drives the point home that you must TEST EVERYTHING! There is no best and everything is relative to the strategy and symbols traded.
There are tons of other variations we could test such as combinations of stops, larger stops, smaller stops, etc. but that is the beauty of Build Alpha which allows you to quickly build and test strategies with no code. It is the first professional no code algo trading software available to all traders.

Need to Know about Stop Loss Orders

Stop Loss Summary

Stop losses are a risk management tool in every trader’s toolbox. Stop losses and stop limit orders aim to limit risk and protect against significant losses. Trailing stops protect against initial losses and then improve to protect gains as the trade proceeds. Mean reversion strategies are often harmed by stop losses where trend following strategies are often improved. Finding the right stop loss vs stop limit and trailing stop strategy depends on the market, timeframe, and strategy type they are applied to. Having useful algo trading software like Build Alpha to run countless backtests and optimize price levels can help identify optimal stop loss strategies for any automated trading strategy.

Author

David Bergstrom – the guy behind Build Alpha. I have spent a decade-plus in the professional trading world working as a market maker and quantitative strategy developer at a high frequency trading firm with a Chicago Mercantile Exchange (CME) seat, consulting for Hedge Funds, Commodity Trading Advisors (CTAs), Family Offices and Registered Investment Advisors (RIAs). I am a self-taught programmer utilizing C++, C# and python with a statistics background specializing in data science, machine learning and trading strategy development. I have been featured on Chatwithtraders.com, Bettersystemtrader.com, Desiretotrade.com, Quantocracy, Traderlife.com, Seeitmarket.com, Benzinga, TradeStation, NinjaTrader and more. Most of my experience has led me to a series of repeatable processes to find, create, test and implement algorithmic trading ideas in a robust manner. Build Alpha is the culmination of this process from start to finish. Please reach out to me directly at any time.

Why Do Automated Trading Strategies Fail?

In my decade-plus of professional trading experience, research effort, and working with thousands of individual traders, consulting for hedge funds, registered investment advisors, Commodity Trading Advisors, and family offices, I have discovered that algorithmic trading strategies fail for two primary reasons or errors and out of sample testing can help.
In this post, we will take a deep dive into how out of sample testing (OOS) can be an excellent approach to combating both of these algo trading pitfalls, remove some uncertainty, increase knowledge, and help estimate better forecasts.

What is Overfitting? What is Curve Fitting?

Curve-fitting, or more commonly referred to as overfitting, is creating a model that too “perfectly” fits your sample data and will not generalize well on new unseen data. In trading, this is a trading strategy that trades the historical data too well and will fail to adapt to new live data (large forecast error). Not the answer we need.
That is, the strategy has memorized the historical data values finding random, spurious patterns that will fail to repeat in new data. Developing your own trading idea, price forecasting, data mining or using machine learning models can all lead to overfitting.
Here are two visuals I found to help illustrate this idea of curve-fitting.
A curve-fit trading system is a trader’s worst nightmare; that is, a trading system that looks great while testing but fails miserably once live. The trading system simply memorized the historical data’s noise and will struggle to predict the noise of new market data.
It is very unlikely the next set of (live) data points will make a milk saucer for the cat in the above photo. Drawing the cat is overfitting the data and poor analysis. It is seeing something that is not really there. A trading strategy that sees price anomalies that are not there will struggle in live trading. OOS testing can help detect overfitting and discover robust trading strategies.

What is a Robust Trading Strategy?

A robust trading strategy is one that is adaptable to changing markets and data conditions. A fragile or overfit trading strategy is one that needs the exact data from the historical period to continue performing as expected which we know the market will not give us.
It is very unlikely that the fragile trading system will help us reach our trading goals. All algorithmic traders strive for robust trading strategies; that is, automated trading systems that have a high probability of performing as expected no matter what the market does.
Finding robust trading strategies is my passion. I took the time to write an in-depth guide on professional stress tests and checks (including OOS) that can help aid in this pursuit here: Robustness Testing Strategy Guide. If you are interested in learning how to better test trading algorithms, then I highly recommend giving it a read next. I am sharing organizational knowledge to be frank.

What is Out of Sample Testing?

Out of sample testing method is splitting the historical time series data into two or more data partitions with the idea of withholding some of the historical data to act as a second, unseen test set. The OOS period acts as an estimation period for live trading.
In trading, the strategy developer would split the historical price data into two sections: the in-sample data and the out-of-sample data. He would then build his trading strategy model on the first section of the data, the in-sample data. This is called model fitting or the learning phase. Once pleased with the strategy after making tweaks, optimizations, adding or deleting rules and filters, doing analysis, he is ready to test the strategy on the second section of data, the out-of-sample data.
The OOS data acts as unseen, untouched data that provides an unbiased view of how the strategy may perform on unseen data. This is a close simulation to new live data as an algo trader can hope.
If the strategy was overfit to the in-sample data, then we could detect such overfitting or curve-fitting on the out-of-sample data by noticing a degradation of performance on the out-of-sample test. That is, if we expect an average profit of $200 per trade from the in-sample data but the out-of-sample test shows a negative -$100 loss per trade then we have overfit to the historical data and the strategy is not robust. A large difference between in-sample and out-of-sample performance may indicate an error or bad assumptions.
This blog will cover the details and methods of OOS testing and how it can help combat against overfitting in algorithmic trading strategy development. On the other hand, if you prefer, please take a look at this video version: Out of Sample Testing for Algorithmic Trading.

In Sample Testing vs. Out of Sample Testing

The in-sample data is the portion of data used to develop the initial strategy, run backtests, optimize parameters, make tweaks, add filters, delete rules, etc. The strategy should arrive in its final form using only the in-sample data.
The out-of-sample data is withheld and unused during the strategy development process. After the strategy model is completed, the trader can test the strategy on the OOS data points. It is often said that if the trading model performs similarly in both the in and out of sample period then we can have increased confidence the trading model generalizes well enough to new data points. That is, we have a good estimation or forecast of what to expect live.
Proper Automated trading software should split the test results for you to reference the In-sample, the out-of-sample, and the combined results of a trading model like Build Alpha does.

How Much Out of Sample Data to use?

The default setting most algorithmic traders will use is 70% in-sample period and the last 30% of the historical data reserved for out of sample testing. That is, if the trader has 10 years of historical data, then the first seven years will be used to develop the trading strategy and the remaining three years will be used for OOS.
Other common approaches to in sample vs out of sample splits are to divide the data directly in half with a 50/50 split. The first 50% of the data used for in-sample and the second 50% used for OOS.
However, the test period, OOS location, and the percentage of OOS chosen can be very critical to the trading strategy’s success. I have always heard that good science is often mostly attributable to good experimental design. In the trader’s case, good science would be setting up a proper test by choosing an appropriate test period, OOS location, and OOS percent.

Out of Sample Test Period Selection – How the Human Adds Value

Below is the S&P 500 from 2004 to 2017 with the last 40% of data designated to be OOS (highlighted in red).
We create a trading strategy on the data from 2004 to 2011 – the blue in sample period. However, 2012 to 2017 (red OOS) was largely straight up! If we build a long strategy that avoids most of 2008 via some filter then the strategy may do well on our OOS data, simply because of the bull market.
Did the strategy pass OOS testing or would any strategy have passed this period? The question shows research effort. You can see the importance of intelligently selecting your OOS test period’s location and size.
Let’s use the first 40% of data as OOS. In this case, it allows us to build our strategy on the most recent data (the last 60%) from 2009 to 2017.
Many prefer to build their models on the recent data as it is the most like the live data they will soon experience. They then test out of sample using older data and in our case 2004 to 2008 (the first 40% highlighted red above).
Why 40%? I selected a percentage that would capture the financial crisis. If we build a trading strategy from 2009 to 2017 and then test from 2004 to 2008 and it performs similarly in both periods, then we likely have uncovered persistent edge that generalizes over two unique sets of data.
Selecting out of sample location and percentage is mission critical to better forecasting. Design your test to be as difficult as possible to pass – try to break your system in the testing process. If you do not, then the market will surely break it once you go live!

Out of Sample Selection Improves Trading Strategy Robustness

Testing design and set up is undoubtedly where the human still adds value to the automated trading process. Build Alpha allows users to leverage computational power in system design, validation, and testing; however, the test set-up in BA is still an area where a smarter, more thoughtful trader can capture an edge over his competitors while adding robustness to the output.
Below I have some photos of some terrible experiment design to help drive the point home. Both present fairly simple OOS tests to “pass” and potentially increase the trader’s risk.
The main takeaway is the human can still add value to the automated trading process by proper backtest and experiment design. That is why BuildAlpha software allows the trader/money manager to adjust everything (or nothing) from OOS percent, OOS location, test periods, the minimum number of trades in-sample, and the minimum number of trades OOS.

Randomized Out of Sample Testing – Avoid Luck

Traders are lazy and may not put in the work to find the exact percentage of out of sample data to make their test as difficult as possible to pass. An alternative method is to avoid using a single location for OOS and rather use a randomized selection. Build Alpha software can automatically and randomly select the out of sample period to avoid this common pitfall.
Read more

What are the benefits and pitfalls of Out of Sample Testing?

To explain simply, the main benefits of out of sample testing for algorithmic trading strategy development is a first line of defense against curve fitting and better forecasting performance. That is, out of sample testing helps discard obvious curve fit systems that fail to perform well on unseen historical data. This can save a trader who takes backtest research and immediately goes live with hard earned money only to see the strategy fail immediately. We have all been there.
The pitfall, and an often-missed error, is using an overly optimistic period of data that is too easy to pass. For example, any long strategy should do well in an out of sample period that goes straight up. Being aware of this pitfall, intelligently designing your in and out periods, or using the Randomized Out of Sample test are all ways to combat this and improve your trading research.

Key Takeaways

1. Overfitting first line of defense

out of sample testing can help avoid the avoidable by estimating strategy performance on unseen data. OOS testing simulates live trading.

2. Human can add value

merit to automated trading process by selecting the proper location and size of out of sample data can help create more robust trading models and reliable statistics. Attempt to break your strategies before the market does by designing hard to pass backtests.

3. OOS is rarely enough alone

out of sample testing is a great first step but is not a be all end all. Check out the full Robustness Tests Trading Guide to see the next tests for creating robust trading systems and more accurate expectations.

Need to Know

Out of Sample Testing Summary

Out of sample testing is a research effort and first line of defense to discover overfit and curve fit trading strategies that are destined to fail in live trading. Out of sample testing does not guarantee trading success but can surely help avoid the avoidable. Splitting historical data into a training and testing period allows the trader to properly design, estimate, tweak and optimize a trading system on the in-sample data before doing a final test on the withheld and unseen OOS data. Out of sample testing is the most popular and common stress test for any algorithmic trading strategy. Put this test in your trading toolbox immediately.
Thank you for the professional user contributions “licensed” and to those that share knowledge. That is what makes the Build Alpha community great. I hope you enjoyed this Out of Sample Testing Guide.

Author

David Bergstrom – the guy behind Build Alpha. I have spent a decade-plus in the professional trading world working as a market maker and quantitative strategy developer at a high frequency trading firm with a Chicago Mercantile Exchange (CME) seat, consulting for Hedge Funds, Commodity Trading Advisors (CTAs), Family Offices and Registered Investment Advisors (RIAs). I am a self-taught programmer utilizing C++, C# and python with a statistics background specializing in data science, machine learning and trading strategy development. I have been featured on Chatwithtraders.com, Bettersystemtrader.com, Desiretotrade.com, Quantocracy, Traderlife.com, Seeitmarket.com, Benzinga, TradeStation, NinjaTrader and more. Most of my experience has led me to a series of repeatable processes to find, create, test and implement algorithmic trading ideas in a robust manner. Build Alpha is the culmination of this process from start to finish. Please reach out to me directly at any time.

What is Algorithmic Trading?

Algorithmic trading is the act of placing buy and sell orders through a computer. The trading strategy rules can be defined and given to a computer to execute whenever the entry and exit conditions are true. Algorithmic trading can also be referred to as algo trading, automated trading, systematic trading, or mechanical trading.
Algorithmic trading, or algo trading, is the fastest growing trading style as reports already show
Read more key algo trading stats here.
Algo trading can be applied to any market, timeframe or holding period. Many traders incorrectly assume algorithms only apply to day traders or high frequency traders. All high frequency traders utilize algorithms, but swing traders and longer-term investors may also take advantage of automated trading.
In this complete guide, I will use my decade plus of professional algorithmic trading experience and years of developing Build Alpha to walk you through the
This guide is for traders looking to get into algorithmic trading as well as those well versed.

Can you make money with algorithmic trading systems?

The most common question I receive is, “can you make money with algorithmic trading”? First, the leading 12 investment banks earned about $2 billion from the portfolio and algorithmic trading in 2020, according to Coalition Greenwich. Check out the key algo trading stats link above.
Second, the world’s best hedge fund, Renaissance Technologies, is a large proponent of algorithmic trading systems and automated trading systems generating 66.1% average annual return since 1988.
Furthermore, here is a Registered Investment Advisor client with over $100 million in AUM who shared returns of a few of his clients.
Also, plenty of individual traders can do quite well. There are no limits or restrictions for account sizes. Here are some statements from Build Alpha traders using algorithmic trading strategies with all different account sizes.
55f3f38d-6bc5-4138-b88a-6943d38f4039
Here is a simple strategy that was given away many years ago that continues to do well. This strategy may be too simple as a standalone, but a great idea of what building blocks are possible with algo trading.
It is important to note that all trading, automated or not, involves risk. Additionally, trading returns are often a function of the risk taken. Finally, markets change, and strategies should be monitored on-going. Please respect risk and compete against yourself, not against another trader with a different bankroll. There will be more on risk, monitoring, and position sizing below.

What are the benefits of algorithmic trading?

Can you automate stock trading? Can you automate ETF trading?

Stocks and ETFs are the most popular markets and can certainly be automated. The sheer number of symbols and unique companies presents seemingly endless opportunities for algorithmic traders to capitalize on. The 6.5-hour trading day from 9:30 ET to 16:00 ET are perfect for most traders but even better for algorithm traders. Automated stock traders can review pre and post market results and contain their workday within normal business hours.
Stocks and ETFs do present larger gap risks as unscheduled or surprising news can be released during hours where markets are closed. Since computers never sleep some automated traders feel no need to subject themselves to these risks and explore other markets.

Can you automate Futures Trading?

Futures markets are arguably the favorite market for automated traders. Futures such as equity indexes, gold, oil, and other commodities like corn, wheat, and lean hogs all trade much more frequently than stocks and ETFs; most futures contracts trade nearly 23 hours a day, 5 days a week. This extended trading schedule certainly lends itself to more algorithmic traders and the need to automate.
To learn more about futures read my Brief Guide to Futures I wrote a few years ago or check out futures contract specs on the exchange websites. Here are the specs for the S&P500 emini futures contract.
Additionally, Futures follow the 60/40 tax rule which taxes the first 60% of gains as long-term capital gains and the remaining 40% at ordinary income rates.  Remember the lowest two ordinary brackets for long-term capital gains are 0% so futures provide excellent entry points for small account traders looking to compound their gains while minimizing the tax hit. To read more check out the Section 1256 contract rules.

Can you automate Forex Trading?

Foreign Exchange (Forex) is trading one country’s currency for another and trades 24 hours per day, 5 days per week. This around the clock schedule is perfect for automated trading. Forex is often quoted or displayed as six letter symbols such as EURUSD where if the trader were to buy EURUSD pair he would be buying euros (EUR) and selling dollars (USD). Forex does not have a central exchange the way that stocks and futures do. That means, the forex execution price is often left up to the forex trader’s broker dealer (more on brokers later). It is important to note that futures contract equivalents of most of the major forex pairs do exist.

Can you automate Crypto Trading?

Cryptos trade 24 hours per day, seven days per week, and 365 days per year. Talk about the need for algorithmic trading! For this reason, algorithm trading is very popular among crypto traders.
For those that are unfamiliar, crypto Currencies are digital or virtual currency that uses cryptography to secure transactions. At the time of writing this, the largest market capitalization coins are Bitcoin and Ethereum. Most of crypto currencies are built upon blockchains or online digital ledgers that track all the transactions of a cryptocurrency in public purview. To search for the largest cryptocurrencies, I would recommend using Coin Market Cap.

What kind of Data is needed?

Market data is the lifeblood of algo traders and comes in many forms. Regardless of the market, the most common form of data are time-based bars. Each bar contains a time interval’s Open, High, Low, and Closing price. These bars are often referred to as OHLC bars.
Bars come in all timeframes such as 5-minute, 15-minute or 60-minute bars. 15-minute bars simply means that one bar occurs every 15 minutes and at the end of 15 minutes another bar begins. Here is what a sample data file and OHLC chart look like:
There are many great free sources of daily financial data for all financial instruments. Here are a few free S&P500 daily data sources:
Side note: Build Alpha does come with a full database of all markets, 1 minute up to daily, weekly, monthly for all symbols.

What Type of Programming Language is best for algorithmic trading?

Excel

is expanding by creating functionality to retrieve live stock prices in Excel.  Excel was my starting point into quantitative trading and allowed me to view price data, calculate indicators, and build some rudimentary backtests. For longer-term trading, excel is a suitable solution. However, you will quickly outgrow excel when you need faster testing.

Python

is the fastest growing and most popular programming language. First, python code simpler to read and learn than any other language as python is known for its simple syntax and easy-to-read code. Second, many public code libraries are posted all over the internet. Odds are someone already built a python library for your idea. Don’t reinvent the wheel – just use the existing python library. Third, it is easy for data science and machine learning which many professional quantitative traders utilize daily.  
Python’s drawback is speed. If you want to search large intraday datasets, then python is rarely the best choice. If you are interested in seeing a concrete example of building a trading signal in Excel and Python then please check out: How to Build an Algo in Excel, Python, Build Alpha

C++

is the fastest, most robust coding language. It is widely considered the best choice for competitive programming by 75% of programmers, according to Geeks For Geeks: Why Cpp Is Best. However, the added benefits of C++ come from the steep learning curve and complex syntax used. My market maker, high frequency trading mentor started me with C++ but there are definitely easier starting points in hindsight.

No Code

If you do not want to program, then keep reading to learn about Build Alpha – no code algo trading software.

What is a trading broker?

A broker is an intermediary between those who want to trade and the exchange. You need a broker because exchanges require those who execute trades on the exchange to be licensed. Brokers typically charge a small fee, referred to as a commission, for their service. However, many brokers have begun offering $0 commissions.

What is the best trading broker for algorithmic trading?

The brokers I recommend for algorithmic trading are TradeStation and NinjaTrader. Let me breakdown the pros and cons as well as some feedback from the Build Alpha community.

TradeStation

is an award-winning broker well known for their trading platform and proprietary coding language Easy Language. Easy Language is a simplified language created to help traders code. Traders can create strategies with much less effort than a traditional coding language. TradeStation also has beautiful charts and a relatively fast platform.
If you are interested in opening a TradeStation account, please contact me and I can put you in touch with the Build Alpha rep. TradeStation is assisting new traders get started with Build Alpha. Ask me how.

NinjaTrader

is a fast-growing broker that also has their own coding language called NinjaScript. NinjaScript is a simplified version of C# but is a bit more complex than TradeStation’s Easy Language. The added complexity does come with additional benefits and flexibility albeit with a steeper learning curve. NinjaTrader also has a great ecosystem of third-party vendors who release indicators and other trading tools.
Both TradeStation and NinjaTrader allow you code strategies in their proprietary coding languages and automate them directly inside their trading platforms. I know, what if you can’t code? Keep reading!

How to automate my trading system? Coding to Broker or no coding to broker.

You can code your strategy in Python or C++ (or any other language) and connect to a broker’s API or application programming interface. An API is essentially a public library that explains how your code can communicate with someone else’s code.
Both options above are for programmers and those traders with the appetite to learn programming. Coding strategies yourself can lead to errors and has a steep learning curve. Certainly, a measure twice to cut once endeavor.
But what if you do not want to write code? You need strategy testing software that builds algorithmic strategies and generates code for you. Does that exist? Yes. Automate your trading with no coding.

What is the Best Algorithmic Trading Software?

Build Alpha Strategy Builder

Build Alpha is built after my own hardships learning to code and the need to test an endless stream of trading ideas in financial markets.
Instead of coding every single trading idea, I thought I would build software that could test all my ideas at once with no coding.
Build Alpha allows the trader a point-and-click interface to select
and then passes all inputs to a genetic algorithm which will find the best algo strategies for you.
For traders that do not have time to learn to code or want to test their trading ideas faster than coding can enable, then Build Alpha is the answer. Check out the Build Alpha homepage or request a demo.

What are the types of Algorithmic Trading Strategies?

Different trading rules will create different trading system styles and characteristics. Let’s breakdown the two most popular trading strategy frameworks and their associated characteristics.

Trend Trading

is a trading strategy that attempts to capture large directional moves or continuations in price trends. Trend trading will hold the trade until momentum shifts and is most popular among the swing trading and longer-term trading accounts. The simplest form of trend trading is buying when price crosses above a simple moving average and selling when price falls below a simple moving average. Trend Trading is often characterized by frequent small losses and infrequent large wins. The large infrequent wins often make up for the small infrequent losses.
A quick algorithmic trading history lesson: The Turtle Traders were 23 novice traders who became literal millionaires overnight in the 1970s due to a trend following strategy. Two professional traders and industry experts shared their strategy with these novices to test the novice traders’ discipline. It is an amazing story, and the strategy is well known now after being detailed in books. The strategy is not quite as successful over the most recent decades, however.

Mean Reversion

often called countertrend, trading looks to capitalize on extreme moves in price action assuming price will revert to its average price. Mean reversion can be thought of as the opposite of trend following. Mean reversion can be simply described as a deviation away from a simple moving average or previous average price with the assumption price will return to its average price. As price moves away from the average, traders would look to buy (or sell) shares until price returns to the average. Countertrend trading is often characterized by small, frequent wins and large, infrequent losses.

Are there different types of Algorithm trading?

There are many different types of trading algorithms and many will be left out of this guide to keep this comprehensible. There are a handful of other common algo trading styles worth noting.

Seasonality

According to Investopedia.comseasonality is a characteristic of a time series in which the data experiences regular and predictable changes that recur every calendar year. A simple example is retail stocks catching a bid before holiday sales numbers or energy stocks selling off after a mild winter. Seasonal trading is the most basic kind of trading rules we can define because it is as simple as buy on this day of the year and sell on this day of the year.

Breakout Trading

is a subset of trend trading. A breakout occurs when price breaks above a significant past price level. Many technical analysts and chart pattern traders enter on breakouts. Traders must be sure to quantify the set up and breakout to truly understand if the breakout is a repeatable edge and works across symbols. Most breakout traders look to exit quickly instead of riding the potential ensuing trend.

Price Action Patterns

This style is best described in Jack Schwager’s book Hedge Fund Market Wizards,
“This category of systematic approaches whose signals do not seek to profit from either continuations or reversals of trends. These types of systems are designed to identify patterns that suggest a greater probability for either higher or lower prices over the near term.”
Simple examples would be if today’s close is below yesterday’s low or if today’s high is above the previous two day’s highs. These price patterns can often be combined to gain a sense of where the market is likely to go next.
There are various other types of trading styles. Here are a few more (not an exhaustive list). However, these are not great starting places.

How to get started with algorithmic trading? What signals are best for automated trading systems?

Price Action

is comparisons of open, high, low, and close data. The close is higher than the close two bars ago or today opened above yesterday’s high. Candlestick patterns are variations of price action; however, they often have misleading names that do not match the data as I pointed out here: Trading Truths.

Fundamentals

Is the company growing revenue? Are margins expanding? Is the company reinvesting? Quantifying fundamentals is great for institutional investors but rarely used for short-term trading. Public companies are only required to give updates once per quarter.

Technical Analysis Indicators

like volume weighted average price (VWAP) and Stochastics provide price summarizations. I have done many tests with technical analysis, and there is no holy grail. One technical indicator may provide value on a certain symbol or timeframe but may show completely different results on another. Here is a quick video I did on technical indicators: Build Alpha Auto Trading Software testing RSI and MACD Strategies.

Chart patterns

are geometric shapes connecting price levels. Traders draw these lines under the assumption price consolidates before an explosive move. It is important to quantify and test chart patterns. I worked with a PhD in geometry to quantify chart patterns as signals in Build Alpha. Here are the most common chart patterns:

Intermarket

Perhaps you only want to trade stocks if gold is doing XYZ and avoid stocks if bonds are doing ABC. These inter-market relationships are extremely powerful and popularized by the late Murray Ruggiero. His book Cybernetic Trading Strategies is still one of my favorites.

Multi-timeframe

Analyzing what a symbol is doing across timeframes may also lend key insights or confirmation to take a shorter-term trade. For example, enter a long position on the 30-minute if the daily and weekly charts are trending up.

Additional and Alternative Data to Give Context to Trading Algorithms

Economic Data

How healthy is the economy? Is Gross Domestic Product expanding or contracting? Is employment strong or is a recession looming? Deflation or inflation? Any of these factors may influence if we are long or short or what markets we should trade.

Market Breadth

can give insights into what is happening under the market’s hood. How healthy is the market? How many S&P500 stocks are trading above their moving average? Do we notice lots of buying activity on exchange or is most in dark pools? What percent of stocks are near all-time highs?

Risk Factors

watching the volatility index, VIX, can help gauge traders’ and market makers’ appetite for risk. If VIX is spiking, then perhaps trading styles should change. Maybe VIX above a certain level should activate hedging algos. Ignore the market’s risk readings at your own peril.

Options Flow

Understanding options can provide an edge to your strategy development. Options metrics such as risk reversal pricing, gamma exposure, and the relationship between implied and realized volatility can add needed context to trading the underlying securities. How are market makers and dealers positioned? Do you want to fight the tide or ride the wave?

Alternative Data

many professional traders and firms utilize alternative data with price data. This extra data can give their algorithms insights the price data cannot. Alternative data can include scrapping job postings to see who is expanding, tracking rail car weights and shipping cargo weights, monitoring satellite images over parking lots to gauge production levels, sentiment data scraped from twitter, etc. Creativity can often win the day. Build Alpha was designed to accept alternative data as I know how flexible traders need to be.

Backtesting Algo Trading Strategies and Automated Trading Systems

To create a strategy, we need to have historical price data and pre-determined trading rules or signals. We can apply any trading rules to the data to generate the historical trade results – this process is known as Backtesting. I wrote a full guide on backtesting here: Backtesting Trading Strategies.
Build Alpha can create any strategy type we have discussed and generate our list of trades with automatic backtesting. We can also view:

What is the best strategy tester and backtesting software?

Build Alpha’s backtesting engine is extremely fast and unique as the code is written in C++ making it extremely fast and accurate. Accuracy is incredibly important when reviewing backtested results. I am extremely proud of this software as it helps me (and many other traders) quantify and view strategies in a matter of seconds.
There is no need to write any code to test your strategies as it is a completely code-free software. Simply select your entries, exits, risk management and hit Simulate. Build Alpha’s algorithm does the rest.

Algorithmic Trading Strategy Examples and Building Blocks

Losing money? Let’s backtest three example algorithmic trading strategies. All three focus on SPY, the S&P 500 ETF. Each strategy only contains one entry rule and is not optimized. I will leave optimization, adding filters, and testing on you the reader.

Price Action strategy example 1

Price Action strategy example 2

Price Action strategy example 3

These three strategies are not meant to be standalone strategies, but act as an example to demonstrate how price action signals can provide a tremendous starting point to trading system development. All these strategies were tested using Build Alpha’s built-in signal library. The next steps could be to add filters, indicators, alternative context, etc. but first let’s explore performance metrics.

Best Algorithmic Trading Performance Metrics

After running a backtest to see the hypothetical trades, we can view performance metrics to help us determine how good our algo is. Below are the most common metrics every quantitative and algorithm trader should know.

Profit and loss or P&L

This is simply the total profit or loss generated by the strategy

Drawdown

the amount the profit and loss fell from its highest amount. If the strategy was up $10,000 and then later was up only $8,000 then this is a $2,000 drawdown. Often simplified to the maximum drawdown as many drawdowns occur.

P&L / Drawdown

is a metric comparing the total profit earned by the drawdown. The higher the ratio the better, generally speaking.

Win Percentage

is the percentage of trades that returned more than $0 divided by the total count of all trades.

Ratio Win to Loss

is a risk:reward metric comparing the average winning trade to the average losing trades. The higher the number the better.

Profit Factor

compares the total gross dollars made on winning trades divided by the absolute value of total gross dollars lost on losing trades. This value is a ratio of two positive numbers so we cannot experience a profit factor less than 0. Additionally, any profit factor from 0 to 1 is not a profitable strategy with losses exceeding gains.

Sharpe Ratio

developed by Nobel laureate William F. Sharpe is a metric showing the ratio of average return compared to the drawdown. More simply, the average annual return divided by the standard deviation of the return. There are arguments for Sortino Ratio which does not penalize “upside volatility” as Sharpe does, but this guide is not the place for a deeper dive.

The pitfalls of algorithmic trading strategies

I need to share the common pitfalls of strategy testing. Later in this guide I will link to a more exhaustive list of tests we can use to improve our probabilities of success, sidestepping these below landmines.

Poor data

missing data can materially impact your results. Assume you had missing data from 2007-2008. Not good.

Look ahead bias

mixing data sets such as intermarket data or multiple timeframes brings a possibility you incorporate unknowable future information. For example, we cannot use the day’s closing price to make a trade at 12 noon as the day’s close is not yet known.

Survivorship bias

many data providers only provide actively listed stocks. We need to include stocks that delisted, went bankrupt, merged, went private, etc. Without these symbols then our backtest may be more favorable than it should be.
1cf91fe5-de58-466d-865f-6e9582c2f89e

Favorable conditions

maybe you tested in a bull market, and any strategy would have done well. Test on all market conditions and environments! I wrote about ways to combat this here: Randomized Out of Sample Testing

Real market environment

can be impossible to know the historical liquidity and some software will allow you to buy more shares than the total volume. This could not happen in real market environment without drastically affecting the share price.

Underfitting

an algo that is too simple will “underfit” the market’s past data. This means it will not capture any unique price anomalies in the future.

Overfitting

an algo that is too complex will “overfit” the data capturing noise and mistake it for unique price anomalies in the future. Over optimizing parameters or having too many rules are the most common culprits of overfitting. Overfitting is often referred to as curve fitting in finance. Curve-fit strategies fail as the market changes and trust me it changes.

Robustness Tests for Algorithmic Trading Strategies

A robust trading strategy can stand the test of time and changing market conditions. Quantitative trading firms employ a litany of statistical tests, stress tests, and robustness checks to attempt to find good fit and robust systems. In this section, I will introduce useful concepts from my professional trading experience and a decade-plus of primary research into the topic of trading strategy robustness.
Robustness testing is a vast area, but if done well, can be a trading edge over other market participants because many fall short here. This is by no means an exhaustive list but can surely increase the probabilities of algorithmic success.
To read more about robustness testing for algorithmic trading please check out my full guide: Robustness Testing for Algorithmic Trading Strategies

In sample and Out of Sample Testing for Algorithmic Trading Strategies

The first line of defense against overfitting is to split the historical data into two segments: the in-sample data and the out-of-sample data. The split can be placed anywhere but traditionally most traders use 70% of the data as in-sample and the last 30% of the data as out-of-sample.
To learn about intelligently splitting the data, please check out:
We build our algorithmic trading strategy on the in-sample data leaving the out-of-sample data untouched. Once happy with our strategy’s performance, we then test the strategy on the unseen, untouched out-of-sample data.
If the strategy performs well on the out-of-sample data, then we should have heightened confidence our strategy should do well on other unseen data.

Additional Robustness Checks for Automated Trading System

Vs Random

Is this a good strategy or was it pure luck? This test was discussed by Jaffray Woodriff of Quantitative Investment Management in the aforementioned Hedge Fund Market Wizards (Schwager, 2012).
The test creates the best possible random strategy to use as the benchmark to beat. The best possible random strategy is the best possible by chance (random). If we beat the best random strategy’s performance, then it is more likely real edge and not something lucky.
Build Alpha runs this every simulation. Below shows a real strategy vs. the best random strategies possible.

Vs Others

Does the strategy work on other markets? A SPY strategy that fails on other market ETFs such as QQQ, DIA, or IWM is likely overfit to the noise specific to the historical S&P500 data and will fail when noise changes. Strong performance across related markets is a strong sign of robustness.

Vs Shifted and Vs Noise

Markets like oil and corn have natural consumers whereas this is untrue in stocks. Testing across other markets may not make sense in these markets. The fix? Shift or add noise to the original data then re-trade the strategy on the shift or noise-adjusted data.
If the algo remains profitable on the adjusted data, then we get a confidence boost we did not overfit to the historical noise and the strategy can survive future noise variations.
If the noise test shows losing strategies, then we have overfit to the historical data. To read more about the noise test check these out:
These quick explanations skip nuances and certain tests were left out. Please read the comprehensive Robust Trading Strategy Guide to learn about other tests such as: variance testing, delayed testing, liquidity testing, and more.

Trading Algorithm Position Sizing. Can a computer size my trades?

There are a handful of popular position sizing methods used by algo traders. All these methods could be coded or generated from Build Alpha to apply to any strategy. In this section, let’s break down a few of the most popular sizing methods:

Fixed Size

taking the same size position every trade, i.e., 100 shares or maybe 1 futures contract or 1 forex lot. The algorithm would continue to buy and sell 100 shares regardless of price movement.

Fixed Dollar

the trader sets a dollar amount per trade and then the algorithm would buy that dollar amount of shares each trade. As the share price rises, the computer would purchase less shares. As the share price falls, the computer would purchase more shares. It is important to note that the share amount is calculated prior to each entry and unchanged while in a position.

Volatility Based

the computer will size the position based on the symbol’s volatility (typically Average True Range). As volatility rises, the computer will trade smaller positions. As volatility falls, the computer will trade larger positions. It is natural to reduce position sizes as risk (volatility) increases.

Risk Percentage

this method can only be used when the strategy uses a stop loss. The trader determines an amount he is willing to lose per trade. The computer will determine the distance between the entry and stop loss and then size the position so that the max loss is the amount the trader is willing to lose. This aggressive style does not account for when you cannot exit at your stop loss (gaps, illiquidity, missed orders, etc.). Some losses can exceed the amount a trader is willing to lose.

Do I have enough capital for this automated trading system?

One of the largest and most common pitfalls traders make is not setting aside enough capital for their strategy algo. Many traders will look at the historical backtest’s maximum loss or the maximum drawdown and determine this as the amount of capital needed to trade the strategy.
Build Alpha offers a variety of Monte Carlo tests that can quickly aid traders in understanding how flawed the above sizing logic is. Let’s work from an example that had a worst trade maximum loss of $816.88 and a maximum drawdown of $981.38.
Running the Monte Carlo Analysis, we easily see that the average drawdown from the Monte Carlo variations was about $1,500 or 1.5x the original backtest’s drawdown. Not using the Monte Carlo Analysis tool could lead to undercapitalizing the strategy causing a premature plug pull and abandoning ship too soon.
However, there is a better approach to find the correct allocation to any trading strategy or portfolio, the Monte Carlo Drawdown method which was popularized in Howard Bandy’s book Quantitative Technical Analysis.

Funding an algorithmic trading system with Monte Carlo Drawdown Analysis

To run the Monte Carlo Drawdown analysis, the trader selects a percentage drawdown he could stomach and a starting trading account size. Most traders cannot withstand a 20% drawdown. 
Next, run 1,000+ Monte Carlo tests resampling from the historical trades to create 1,000+ new equity curves (can reshuffle the trade order as well). Then calculate the drawdown of each new equity curve and plot the 1,000+ drawdowns as a histogram. Finally, plot a cumulative distribution line on top of the histogram (in blue below). This line plots the total percentage of drawdowns as we move from left to right across the horizontal x-axis.
c6a3e2c4-1e6b-4f16-9c08-e66789793439
Tracking up the Y-axis to see where 95% intersects with the blue cumulative distribution line. This spot indicates 95% of all Monte Carlo drawdowns were less than this. Connecting this red X to the x-axis shows the drawdown of 30%.
We can say, “we are 95% confident drawdowns from this trading system will not exceed 30%”.
This value is unacceptable to most. We should strive for a drawdown less than 20%. Meaning, the starting trading account value is too small to trade this strategy and we could easily see a drawdown greater than our pre-determined 20%.
If we increase the account size and run the test again, we can see the 95% confidence spot (red X) is now at slightly less than a 20% drawdown on the x-axis.
041510db-0a47-4782-b54e-dbcad7c4f638
Sizing strategies – and portfolios – properly is one of the easiest ways to ease the emotions of drawdowns. It also makes sticking to a system long enough to escape randomness more doable in turbulent markets.
Read more on this technique and see a strategy example please head here: Properly Funding Strategies with Monte Carlo Drawdowns

Identify Broken (failing) Algorithmic Trading Strategies

To define failing, we must first define passing behavior. Monte Carlo testing once again gives us a guideline. Important to note that other more advanced tests such as noise testing, Vs shifted, Monte Carlo permutation, and Variance testing could also apply. Monte Carlo results give us a cone of what is possible at trade number X.
In the graph above, we can see that after 100 trades the strategy’s P&L should be anywhere from $0 to $15,000. This is a large range but gives an idea of what our expectations should be at trade 100.
If at trade 100 the P&L is between $0 and $3,000 then we certainly had some bad luck, but the strategy is not broken! The strategy is just in the lower range of what was possible (bad luck). On the other hand, if the strategy’s P&L at trade 100 is between $12,000 and $15,000 then we had tremendous luck. This success was possible despite not being a conservative estimate at trade 0.
If we are at trade 100 and the P&L is less than $0 or greater than $15,000 then we are outside expectations. This is the first sign things are broken (not going as expected).
Build Alpha has a tool that generates Monte Carlo bands from the last trade and plots forward as many trades as desired. It is best practice to only trade strategies that have a flat or upward sloping lower band.
If performance is falling outside the red Monte Carlo bands, then it is best to do at least one of the following:
To read more on Monte Carlo Simulation and applications to algorithmic trading please check out: Monte Carlo Simulation Complete Guide

Algorithmic trading success needs the portfolio approach

The perfect strategy or “holy grail” hunt is often the worst adventure one can embark upon. I lived this for many difficult years chasing chat rooms, magic indicators, and more to hopefully learn that the one missing piece. Turns out there is no one missing piece.
The holy grail is combining uncorrelated strategies to smooth returns. Ray Dalio of Bridgewater, the largest hedge fund in the world, shared a graphic in his book Principles showing the math behind the true holy grail: adding uncorrelated strategies together.
On the right-hand side, the more uncorrelated strategies you combine the lower your probability of losing money. Lightbulb moment. I don’t need a perfect strategy; I need a bunch of good strategies working in concert.
Michael Jordan needed someone to do the dirty work: play aggressive defense, check defenders down low, grab rebounds, make hustle plays. He did not need someone else to score points. Your portfolio needs a team mentality. Some players are not great on their own (cough Rodman), but on a team, they fill a role making everyone exponentially better.
That’s right, some strategies may not be profitable but still additive to your portfolio! Certain strategies do well in certain markets while other strategies do well in other market conditions (aka doing the dirty work the core strategies cannot).
In the graphic above, strategies A and B are the best standalone strategies as strategy C has a negative return! However, when combined (and scaled to the same volatility), A+C do much better than A+B. When A yins, C yangs. Conversely, A and B ebb and flow at the same time (two scorers). A+C provide an awesome example to the team, or portfolio, approach Dalio mentioned.
There is more to be gained understanding this than hunting the perfect strategy.

Key Takeaways

Need to Know

Summary of the Complete Algorithmic Trading Guide

Automated trading systems are the fastest growing portion of the market comprising nearly 75% of the daily volume according to the previously mentioned 2018 study. The 12 largest banks and top hedge funds, including the best hedge fund of all time Renaissance Technologies, all utilize algorithms and automated trading.
The data and tools to build your own algorithmic trading strategy have never been more accessible or even available to individual traders as they are today. Build Alpha is an all-in-one, start to finish algorithmic trading strategy development tool that enables traders to follow the steps laid out in this guide without having to write any code.

I am on a mission to develop Build Alpha as the best automated trading software. Please take the ten minutes to check out the demo and see how it can help any level of trader save time, reduce uncertainty, and hopefully gain an edge in algorithmic trading. If you have any questions, please email me anytime.  For more on Algorithmic Trading please check out FINRA the Financial Industry Regulatory Authority.

Author

David Bergstrom – the guy behind Build Alpha. I have spent a decade-plus in the professional trading world working as a market maker and quantitative strategy developer at a high frequency trading firm with a Chicago Mercantile Exchange (CME) seat, consulting for Hedge Funds, Commodity Trading Advisors (CTAs), Family Offices and Registered Investment Advisors (RIAs). I am a self-taught programmer utilizing C++, C# and python with a statistics background specializing in data science, machine learning and trading strategy development. I have been featured on Chatwithtraders.com, Bettersystemtrader.com, Desiretotrade.com, Quantocracy, Traderlife.com, Seeitmarket.com, Benzinga, TradeStation, NinjaTrader and more. Most of my experience has led me to a series of repeatable processes to find, create, test and implement algorithmic trading ideas in a robust manner. Build Alpha is the culmination of this process from start to finish. Please reach out to me directly at any time.

What is a Robust Trading Strategy?

A robust trading strategy can withstand the tests of time and evolving market conditions. A large key to successful algorithmic trading lies in gauging how likely a strategy is to fail in new market conditions. A trading strategy that can deal with market shocks, volatility, changes, and price swings is a robust strategy.  Robustness can be equated to reliability. Robustness Testing is key to identifying potential reliable trading systems.

What is a Robustness Test?

A stress test or statistical test to help validate or break an algorithmic trading strategy prior to risking real capital. Robustness tests help identify trading strategies that may fail in live trading prior to risking hard earned money. Avoiding bad trades and trading systems can be equally as important to reaching your trading goals as finding good strategies.
Trading losses make trading so much harder! Warren Buffet, the greatest investor to ever live, is quoted as saying, “the first rule of an investment is never lose money. And the second rule of an investment is never forget the first rule.
Robustness testing or checks are stress test methods for measuring reliability in systems. These methods have the ability to identify lying backtests, determine sufficient risk capital, and avoid catastrophic strategies before you potentially lose real capital.

Why are Robustness Checks important in Algorithmic Trading?

Too many algorithmic traders believe a backtest is enough to take a strategy live. Failing to check your strategy’s robustness can lead to substantial and quick losses when moving your strategy from the development stage to live trading.
A robustness check can help reduce the probabilities that a trader risks his hard-earned money on a lying backtest aka a strategy doomed to fail. Identifying strategies doomed to fail can help traders save capital.
Robustness checks allow the trader to make smarter decisions with his capital without being misled by lying backtests.
Additionally, the math behind avoiding losses is convincing
If you lose x% what gain is required to break even?
Warren Buffet is right. Losing money makes trading, and investing, much harder. If we have methods to help avoid losses, then what are they?

Do Robustness Tests and Checks guarantee Trading Success?

Nothing can guarantee trading or investing success. In this guide, I will walk through various robustness methods and checks that can help raise the probabilities we only risk capital on strategies with high chances of success. Nothing is a guarantee but shifting the odds in our favor is often good enough.

What are the best Robustness Tests for Algorithmic Trading Systems?

Each of these robustness techniques will be covered in detail in this guide. Feel free to skip ahead but I would not recommend it! First let’s cover some basics.
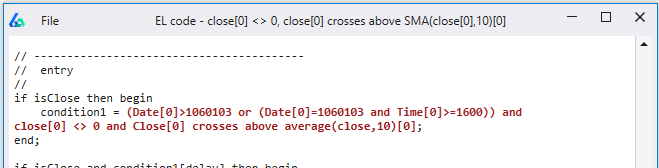
Why do my trading algorithm strategies fail?

Over the last ten years of professional trading experience and the last five plus years of interacting with the Build Alpha community, I have found there are two main reasons that trading strategies fail
There are certainly other reasons, but let’s take a moment to break down these two as they are undoubtedly the most common.
First, most strategy developers fail to include context into their strategy. Is it a bull market? Are interest rates rising or falling? Is inflation increasing or decreasing? Is the economy doing well? The market and big money players need large signals to move large amounts of money.
Most individual algo traders design strategies around price action signals or technical indicators and fail to account for market context. When the market changes, these strategies inevitably suffer.
Second, many strategy developers become obsessed with getting the best backtesting results possible. Traders will tweak strategy parameters until the backtest’s equity curve moves from the lower left to the upper right with zero turbulence. Ah, the perfect strategy!

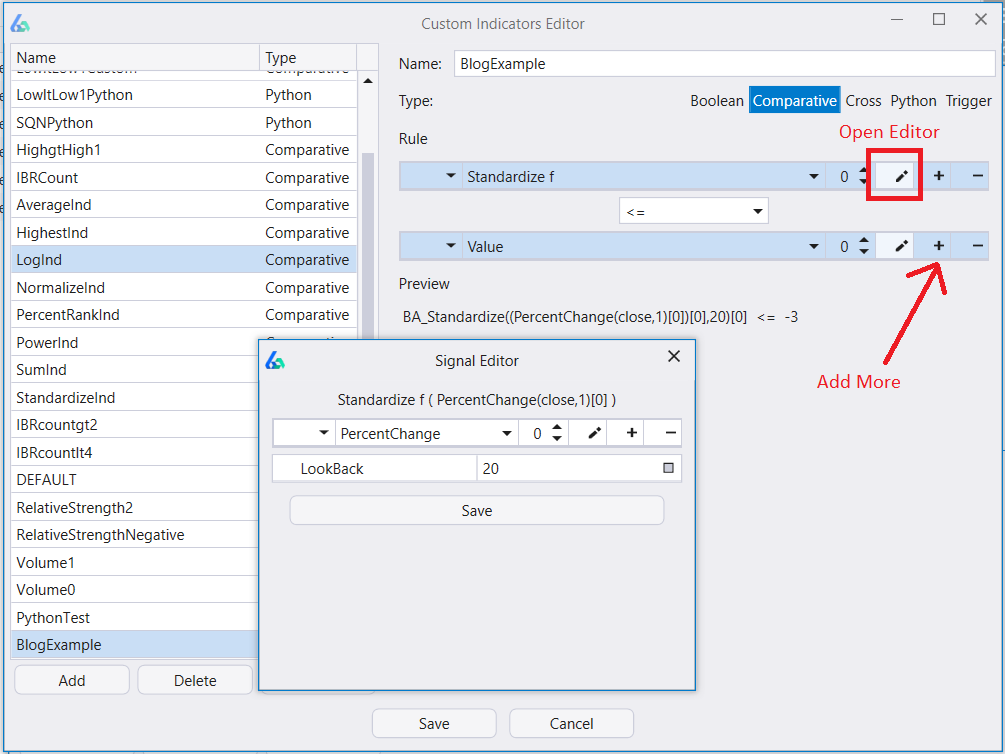
These unrealistic expectations cause traders to overfit the history data. Is there a reason the 37-period moving average should work best? What if the 36-period and 38-period result in bad results and negative net profit or profit factor?
The live data will ALWAYS be different than the history data, so any strategy that needs new data to be nearly identical to the historical will fail in real trading and cause significant risk.
If you are looking to build your first automated trading strategy, add context to an existing strategy or want to see a complete guide to building automated trading systems, please check out this: Algorithmic Trading Complete Guide

What is Overfitting and Over-optimization in strategy development?

Overfitting is creating a strategy that too perfectly fits the historical market data and will not generalize well on new unseen data. A trading strategy that memorizes the noise patterns of the historical data will fail when applied to new or unseen data.
An overfit strategy just learns the exact cadence of the historical market data but nothing useable going forward.
It is very unlikely the data actually created this cat. It is even more unlikely the next set of plots will create a milk saucer. Bad trading advice.
Many strategies have parameters that can be tweaked to improve the strategy’s historical performance. For example, a simple moving average system may buy when price moves above the 50-period moving average and sell when price falls below the 50-period moving average.
Traders will optimize this parameter setting of 50 to create the best possible backtest. Perhaps the best backtest results are generated when buying on a cross of the 63-period moving average and selling when price falls below the 12-period moving average.
Another example of overoptimizing would be to have very specific values such as a stop loss of $217.34 or using a signal such as 12-period RSI crosses above 66.19. These values may produce excellent historical winning trades but are surely meaningless as we go live, and we have unknown data.
This is particularly common in forex trading and strategy vendors.
Do not optimize every penny or hundredth to find the “holy grail”. It is the surest way to overfitting.
But how can we know if we have over optimized or found ideal strategy parameters? That is the need for Robustness testing or strategy robustness!

What are the best robustness tests for algo trading strategies?

There is no single best test and depending on the strategy’s characteristics other statistical tests may be more valuable to what you are trying to disprove than others. For example, a trend following strategy should be tested a different way than a mean reversion strategy. Let’s walk through some examples and circle back to identify a good strategy.

In Sample and Out of Sample Testing

The simplest test we can implement as a first line of defense against curve fitting is an in-sample and out-of-sample split. Most traders use the first 70% of their historical price data as the in-sample data and the last 30% as their out-of-sample data.
First, build a trading algorithm on the first 70% where you can tweak, optimize input parameters, add or delete rules, etc. Once pleased with the trading algo’s results, we can test on the unseen, untouched out-of-sample data.
If the strategy performs well on the out-of-sample data then it is a good sign that the strategy may hold up well on live, unseen data.
There are many considerations with out of sample testing such as where to split the data, how much data is needed and more. To dive deeper, check out

Randomized Out of Sample Testing

What if the out-of-sample data was the beginning of a monster bull market? Is it possible our great out-of-sample results are lucky and we are at high risk? Any strategy could have done well during this out-of-sample period.
This is certainly a risk with out-of-sample testing, but we know how to combat this! If you do not wisely select your in and out of sample split, then you could utilize the Randomized Out of Sample test.
This test simply selects random bars and assigns them to either the in-sample or out-of-sample portion. Then we trade on our data and take any trades entered on in-sample dates to be the in-sample trades and any trades entered on randomly selected out-of-sample dates to be the out-of-sample trades.
To avoid any “luck” during this test, we can repeat 1,000+ times. Here is practical example Randomized Out of Sample Testing

Vs Random: using the best random trading strategy as a benchmark

One of my favorite tests, I even mentioned it in the Algorithmic Trading Guide linked above. This test comes from Jaffray Woodriff of Quantitative Investment Management and aims to answer the question, could we have done this well by luck?
The test generates the best possible random strategy by using random data with real signals, random signals with real data, a combination or mix of the two, etc. The goal for any trading strategy is to have better performance metrics than the best random strategy.
If our research can beat the best random strategy, then we can have confidence the strategy contains real edge and could not be produced by chance (random).

Vs Other: testing trading strategies on other markets

Ideally, we want to see trading systems do well across various related markets. A trading strategy on SPY should do well on other markets such as QQQ or DIA. If a strategy performs terribly on related markets, then it is likely the strategy was overfit to the noise in SPY’s historical market data.
Build Alpha Trading Strategies Across Markets Robustness Test
It is often unnecessary for a strategy to perform well on unrelated markets as market participants may vary drastically creating different data characteristics. Equities have a natural upward drift as companies exist to make money. Oil and corn have natural producers and consumers whereas stocks do not. Forex trading has no central exchange.
These differing dynamics bring different traders, hedgers, and investors to the respective markets. These different players leave different footprints thus possibly rendering a strategy that works in one area useless in another.
Of course, a strategy that does well across all markets – related or not – is ideal. However, these are often very hard to come by.

Vs Shifted: shifting the data to re-test trading strategies

Every charting and data provider uses hourly data from the top of the hour to the end of the hour. That is, 10:00 to 11:00, 11:00 to 12:00, and so on. However, what if we shift the opening and closing time by 1 minute? By 2 minutes, by 3 minutes, etc.? Maybe our shifted data now opens at 10:03 and closes at 11:03, for example.
Now we have additional data that has the same properties but isn’t identical to the historical market data we built our strategy upon. This data is good to evaluate if our strategy requires the exact historical data patterns for success or not.
Shifting the data works on any timeframe and may change bar patterns, high and lows, consecutive up or down streaks, indicator calculations, and more. A long strategy needing four consecutive red bars and a close in the bottom 20% would trigger a big win on the left but would not enter on the right.
Re-trading your strategy on shifted data can give insights on how overfit your strategy was to the exact patterns available in the historical market data. Past performance should maintain across shifted data sets. If performance degrades on shifted data, then it may be a warning sign your strategy is over optimized.

The Noise Test for robust algorithmic strategies

Overfitting a strategy simply means fitting to the noise of the data and not to an underlying signal. The book The Signal and the Noise does a better job than I can differentiating the two. However, we want to find true signals not noise. Noise is random and unreliable.
How can check if we have overfit to the noise in historical market data? We can noise-adjust the historical data by adding or subtracting various amounts of noise (volatility) to the historical price bars. This will create a new open, high, low, close series for us to test our strategy on.
A strategy waiting for four straight green closes to initiate a short entry would take a trade on the original data, but have the trade skipped in these two noise-adjusted variations at the circled bar.
Repeating this noise test to generate 1,000 or more new noise-adjusted data sets is a good start. Then we can re-trade the same strategy 1,000 times and view how the same strategy would perform if the noise wasn’t exactly how it was in the historical data.
If the noise adjusted results are no longer profitable, then the strategy was fit to the historical noise. If the noise test remains profitable then we can have increased confidence our strategy was not overfit to the historical noise.
To read more about the specifics of the noise test please check out a couple of these articles I wrote

Monte Carlo Simulation for Trading Strategy Development

The most popular robustness testing method. There are many variations and uses of Monte Carlo Simulations and Monte Carlo analysis so let’s break down a few below:
Reshuffle – reshuffle the order of historical trades and repeat 1,000 times to create 1,000 new equity curves. Since we are reshuffling the order, we end at the same spot, but the path changes, showing how our account could have fared if the trades did not play out in the sequence they did. You will notice a larger maximum drawdown than the backtest.
Resample – randomly select a historical trade until you reach your backtest’s total trade count. You can randomly select the same trade aka resampling with replacement. Repeat 1,000 times until you have 1,000 equity curves. Since we allow for the selection of the same trade, we do not end at the same spot. This test can provide more variation as the worst (or best) trade can be selected multiple times.

Advanced Monte Carlo Tests for Trading Algorithms

Randomized – We can randomize the entry and re-trade our strategy 1,000 times. On the other hand, we can re-trade our entries and randomize the exit. If your original strategy had no stop loss, then you should not randomly apply one. We should only randomly select and vary exit logic in the original strategy. If the Randomized Monte Carlo remains profitable, then it is likely we have true edge in our entry.
Permutation – reshuffling the log of inter and intrabar price changes then exponentiating to recreate new bars. This creates synthetic data containing most of the statistical properties of our original data while destroying most of the patterns. We can re-trade our strategy on 1,000 new synthetic data series to see if our strategy holds up. This technique was popularized by Timothy Masters in his latest book Permutation and Randomization Test for Trading System Development.

Variance Testing for Trading Strategy Validation and analysis

The variance test takes the historical trades and creates a probable distribution to resample. Next, the test selects random trades from this distribution until it reaches the backtest’s total trade count. It repeats this process 1,000 times.
The trader can vary a performance metric, so the test only accepts variations that perform below the original backtest’s metric minus the trader’s input. The trader can now view how varying performance metrics affects the strategy’s variance.
For example, assume the backtest had a win percentage of 61% and the trader set the test variation to 5%. The variance test would only display variations that had a win percentage of 56% or lower.
This test allows a trader to view how a strategy would perform if things do not go as the backtest suggests they should. News flash – things never go as well as the backtest suggests. Now, the trader can answer if he would be comfortable trading this strategy in this less rosy situation.
In the above image, we have two Variance Test results. The left side shows the strategy with 0% variation accepting all strategies from the simulation. The right-side shows variance test results with 5% variance selected – meaning only accepting strategies with win percentages 5% below the original backtest’s win percentage.
If live trading were to go 5% worse than our backtest, our strategy is a mere toss-up. A 50-50 bet is never how we want to risk hard earned capital. We want strategies that can maintain performance with slightly less optimistic metrics than the backtest.

Delayed Testing

Delaying a strategy’s entry or exit can be a useful test to determine we have not overlooked more optimal entry or exit points but can also tell us how fragile our strategy may be. If the strategy cannot enter 1 or 2 bars later or exit 1 or 2 bars later, especially for intraday, then the strategy may be showing signs of overfitting.
Delayed Testing in Build Alpha Robustness Testing module
Often a strategy may do better with a delayed entry as a strategy becomes known others begin to front run the entry and then bail when it does not work immediately. Build Alpha permits the option to add delayed entries to any strategy from the settings menu.

Liquidity Testing

Large traders and institutions cannot execute their entire size on the open or the close. The liquidity test shows how a strategy would perform assuming the trader needed to enter from the close and until the next day’s close by taking an average of the two.
The liquidity test also tests the close and the next open and the close to the next midpoint. This test can also serve that if an entry or exit were to be missed does it make sense to put the trade on late.
This example strategy showed promise, but if you cannot get the exact fills and need to scale-in or out due to size then this strategy shows a significantly different drawdown in both 2008 and 2020 market shocks. This could mean substantial risk to your initial investment.

Walk Forward Testing

Walk forward tests smaller in and out of sample periods across the entire period tested on a rolling basis. Re-optimizing each in-sample period then trading the out-of-sample period with the selected parameter settings.

The test then combines all the out of sample periods as your final out of sample results (equity curve).

Below you can see Build Alpha’s Walk Forward results window. The top row is the combined equity curve of all the out-of-sample periods. 

Each row below contains the results from one of the out-of-sample periods or “splits”. This allows traders to inspect as granularly as needed.

Combined OOS results from Walk Forward Optimization

Is Walk Forward a valid approach?

Walk forward testing, popularized by Bob Pardo, is a popular approach to robustness testing but it actually introduces a handful of new risks. The many downsides and pitfalls are discussed in the book Advances in Financial Machine Learning (Pardo, 2018).

Mainly, walk forward analysis only tests a single price path whereas other tests such as Noise testing, Vs Shifted, Variance testing or Monte Carlo Permutation test multiple price paths.

Additionally, due to test design, walk forward analysis splits the data many times creating an increase in data leakage. That is where data from an in-sample period is used during an out-of-sample period. 

The simplest example is to imagine a trading strategy that uses a 200-period simple moving average. The first 199 bars after each data split will reference data from the previous in-sample period. More splits, more leakage.
There are many other pitfalls to walk forward despite its popularity. Remember, robustness testing is about finding what will provide a strong Sharpe ratio and trading performance in the probable future not what has done so on the known historical price path.

Robustness testing parameters through Sensitivity Analysis

Optimizing parameters often leads to more fragile strategies as the risks of overfitting often skyrocket. However, how can we find robust parameters? The simplest rule of thumb is to look for parameters areas that all show similar performance.
That is, if the best parameter setting is 20 then we should aim to see at least +/- 10% showing about as good of performance. In this case, we want to see values 18 to 22 produce similar backtest metrics.
If the parameter values next to the optimal parameter setting causes a large drop in performance, then the optimal parameter setting is too fragile and likely just overfit to the historical data. This trouble can be easily avoided by using 3D surface graphs.
Choosing a parameter value here is too risky as the performance nearby drops significantly. On the other hand, choosing a parameter value in the red section provides a greater perceived margin of safety as the neighboring values show similar performance.

Noise Test Parameter Optimization for trading strategies

Build Alpha takes parameter optimization one step farther equipping you with an additional robust check to the parameter selection process. Build Alpha enables the trader to add noise-adjusted samples to the optimization process so Build Alpha will find what parameter settings work best across all the noise-adjusted sample.
Combining parameter values in a stable region with good performing neighbors and the great performance across noise adjusted data sets then we are doing as much as we can to shift the probabilities in our favor.
The full article with a case study can be found here: Noise Test Parameter Optimization

Stress Testing or Scenario Testing with Synthetic Data

Market shocks are often what gets system traders in trouble. Build Alpha now lets you generate synthetic data with your desired “shocks” to test your strategy against.

You can choose various data generation methods such as noise adjusted data and monte carlo permutated data and also create custom rules such as the synthetic data must have a larger drawdown than the historical data or must take longer to recover from its max drawdown or a whole host of other ideas.

After hitting test, Build Alpha will generate synthetic data sets and only test your strategy against the ones that match your desired rules.

Stress Testing rules can be combined or treated as unique, individual rules. In the latter case, Build Alpha will give each rule its own unique color in the plot so you can evaluate strategy performance across your rule set.

Summary statistics are provided for each rule below the display.

Stress Testing Trading Strategies Build Alpha
Stress Test Chart Display Build Alpha

Should my trading strategy pass every robustness test?

In a perfect world, yes. However, as algorithmic traders, we rarely live in a perfect world. Robustness testing is to help us avoid avoidable catastrophe but is not a crystal ball, unfortunately.
We can never prevent overfitting or truly know if we have not overfit. All we can do is attempt to lower the probabilities that we have overfit, and these stress-test methods help.
Trend following strategies tend to have lower win rates as they look for large, outsized moves. Running a trend following strategy through the variance test while reducing the win percentage does not have much of an affect. On the other hand, adjusting the noise for a trend following strategy seems applicable.
Thinking through what each test is testing and what your strategy is attempting to capture can help find the right tests for each specific strategy.
Remember, putting strategies on a simulated account or trading with reduced size can be another form of checking robustness on live data.

Robustness testing on my trading portfolio or on individual strategies?

Yes, you should do robustness testing on both individual strategies and your portfolio. Build Alpha provides the tools to run all the robustness checks and tests on both individual strategies and portfolios of strategies.
In the previously linked Algorithmic Trading Guide I shared my thoughts on how to build a proper trading portfolio. In this guide, I make the case that bad standalone strategies may have a place in your portfolio as they can “do the dirty work” to assist your star players. These role player strategies will rarely pass robustness tests; however, adding them to your portfolio should not harm the robustness tests of your portfolio!

Robustness Testing Takeaways

Need to Knows

Summary: Robust Trading Strategies require additional testing

Many traders struggle to make algorithmic trading work, but when looking at trading software available it is clear. Robustness testing is not offered in nearly any software. That is why I set out to build Build Alpha and include the various robustness tests and robustness check I have come across over the past decade in my professional trading career. Strategies must survive multiple and ever-changing market conditions.
Robust trading systems are rare and will require the astute trader to discard many strategies in the process. However, discarding strategies before risking hard earned capital is a win in my book. I hope this guide helps you break your strategies before the market does. In the long run, running additional tests and avoiding losses where possible can have a tremendous impact on achieving your trading goals and how a strategy performs.
If you have any questions or additional insights, please feel free to email me anytime.

Author

David Bergstrom – the guy behind Build Alpha. I have spent a decade-plus in the professional trading world working as a market maker and quantitative strategy developer at a high frequency trading firm with a Chicago Mercantile Exchange (CME) seat, consulting for Hedge Funds, Commodity Trading Advisors (CTAs), Family Offices and Registered Investment Advisors (RIAs). I am a self-taught programmer utilizing C++, C# and python with a statistics background specializing in data science, machine learning and trading strategy development. I have been featured on Chatwithtraders.com, Bettersystemtrader.com, Desiretotrade.com, Quantocracy, Traderlife.com, Seeitmarket.com, Benzinga, TradeStation, NinjaTrader and more. Most of my experience has led me to a series of repeatable processes to find, create, test and implement algorithmic trading ideas in a robust manner. Build Alpha is the culmination of this process from start to finish. Please reach out to me directly at any time.

What does EDGE in trading mean?

In financial markets, trading edge is a temporary advantage over other market participants. Having an edge in trading can exist in many different forms but the two most common are information edge and price edge.
Information edge would be insider trading or material non-public information. For example, knowing a company signed a large deal that will greatly increase revenues before other market participants know would be an information edge.
On the other hand, price edge exists from research and data analysis and is a far more common way to build a trading career. Quantified technical analysis or knowing that prices that reach this level have historically been cheap over the next N days can present a price edge. Renaissance Technologies, the greatest hedge fund of all time, is quoted as saying
Renaissance essentially attempts to predict the future movement of financial instruments, within a specific time frame, using statistical models. The firm searches for something that might be producing anomalies in price movements that can be exploited. At Renaissance they’re called “signals.” The firm builds trading models that fit the data.” Source: The Secret World of Jim Simons | Institutional Investor
Regardless of the trading style, swing trader or day trader, a successful trader must possess some edge – it is of vital importance. Trading edges are necessary in the stock market, forex trading, futures markets, crypto, etc.
Trading results will evade you and success will always flow to other traders who possess the ability to identify an edge and manage risk.

What is an example of a trading edge?

An information trading edge can be knowing a company’s quarterly numbers before the public does or knowing merger and acquisition news ahead of the public. This is not legal activity but unfortunately has existed in the stock market since day one.
An example of price edge can simply be putting on a position at a price that has been historically cheap compared to other markets or to its own historical patterns. Trading edge based on price can often be quantified and is 100% legal. This is the most popular form of trading edge and what will be referred to in this post.

Trading Edge Formula

In short, edge is positive expectancy. What is and how do we calculate expectancy?
Expected value is the amount a trader should expect to gain if he were able to place infinite similar bets. EV, for short, is technically defined as the sum of all possible outcomes multiplied by the probability of each outcome’s occurrence. EV can be used as the most rudimentary form of trading edge.
EV = (Probability of Win * how much you win) – (probability of loss * how much you lose)
If EV is negative, we should not take the trade. We do not need a high win rate if the winning amount is large in comparison to what we could lose (think trend following).

There are two levers to move: win rate AND risk:reward. Too many traders get focused on one or the other. This graph is great to visualize how risk:reward and win rate relate.
All values based on $1 risk. 2.5 Reward indicates a profit of $2.5 and a loss of $1
Notice experienced traders can make more trading a 50% win rate strategy with 2:1 risk:reward compared to a trader who is accurate 70% of the time with a 1:1.
Now let’s dive into an example to make sure we fully understand expected value. Let’s discuss a coin-toss game where we have two scenarios:
Would you play this game? Most beginner day traders salivate at 90%-win rates. However, the EV for this game is negative! The formula calculates 90% x $1 + 10% x -$10 = -$0.10. Edge needs positive expectancy.
This is a very important lesson that even with a 90%-win rate you can lose money! And trust me, you won’t win 90% of the time.

Do you need edge in trading?

Yes. If you do not have an edge, you are trading randomly, and no one can succeed randomly as trading has costs and randomness includes negative performance streaks. Most traders and trading strategies fail because they do not know or have an edge.
Most traders do not know or have an edge because they have never quantified their edge to see if it is truly an advantage over time, across symbols, and timeframes. New traders must understand this is necessary to becoming a profitable trader.
The first thing we need is an edge and a way to quantify that edge. Enter e-ratio or edge ratio.

What is Edge Ratio?

Edge Ratio is a quantified metric demonstrating how much favorable price movement occurs in comparison to how much adverse price movement occurs. Edge Ratio measures how much a trade goes in your favor compared to how much a trade goes against you. Edge Ratio or eratio quantifies trading edge.
I wrote extensively about e-ratio here: Edge Ratio in Automated Trading but will give a quick synopsis here.
We can plot eratio where the X-axis is the bars from the entry and the y-axis is how much more the trade is in your favor versus against you.
Blue edge ratio for trading signal. Red edge ratio for random trading signal for comparison
In the image above, we can clearly see that we have the most edge (blue line) six bars into this trade. The edge ratio is about 1.6 meaning we get about 0.6 more units of volatility in our favor than against us.
Trading any signal or entry that has an edge ratio below 1.0 is no better than a random entry determined by a monkey throwing darts.
I also spoke about edge ratio on the Better System Trader podcast.

How long might a trading edge last?

Can we know where to exit positions? Using edge ratio, or eratio, we can see when a trading edge begins to deteriorate. Knowing the edge ratio of an algorithmic trading strategy or any entry can help you determine the best exits and when your trade has overstayed its welcome.
In the above eratio image, you can see that after a hold time of six bars, the trading edge begins to deteriorate. In these cases, the best exit is around the six-bar mark as that is when the trading edge has shown most powerful.

More Winning Trades than Losing Trades does not mean Edge

Retail traders develop a trading strategy and wind-up optimizing parameters until the past performance shows more money than God. This trading approach often leads to overoptimized strategies that look great on historical data but have miserable live trading future results.
An individual trader should look for robust strategies that possess true edge and can survive various market conditions. A backtest that shows more winning trades than losing trades but has a negative or flat e-ratio is often an obvious sign of overfitting. Before you start trading new strategies live, always check the e-ratio to see there is actual edge to be captured and the backtest wasn’t pure luck.

Ways to Visualize Trading Edges

Edge Ratio is the best quantified measure of edge for algo traders, but there are a handful of other approaches to visualize your trading edge that are noteworthy.

Heatmap

we can view the forward returns from the entry where the x-axis shows bars since entry and each y-axis row is an individual trade. The color represents how profitable (green) the return was at each bar from entry. Analyzing two different signals on two different heat maps can clearly signal what was more profitable.

Equity Curve

the equity curve of an algorithmic trading system sums all trades to show the historical account value over time. We can think of the equity curve as the money earned (or lost) over time had a trader followed a specific rule or set of rules. Often strategy choices are obvious.

Distributions

viewing all possible outcomes from a potential strategy can yield greater insights than just the heatmap or equity curve. We can run statistical tests like Monte Carlo Simulation and Analysis – more on this later – or other tests to generate a better sense of what is possible. We can think of this as how does my algo trading strategy do in alternate universes where the price data was similar but not exactly what my universe experienced.
Which P&L range would you prefer to be in after 50 trades? Some strategy paths are negative on the left where all are positive on the right. If markets change, trading systems like the one on the right can provide a buffer.
To read more about visualizing trading edges please check out my original post on See It Market here: What Does Trading Edge Look Like

Best Edge in Trading

Not every trade is a winner and there is no single best edge in trading. The best edge in trading is simply having one and executing it with discipline. We can quantify edge with edge ratio so that presents one way to rank our trading strategies. More capital should go toward stronger edges than weaker ones.
However, weaker edges can be combined via ensemble methods to potentially create stronger ones. I wrote about ensemble methods and strategies here: Ensemble Strategies – Build Alpha

Mental Edge in Trading for additional winning trades

Having a mental edge can also constitute a trading edge. The trading industry has convinced many traders that day trading and using a trading journal creates some mental edge. However, a mental edge should be thought of as additive and not a stand-alone edge!
For example, having a mental edge but no price edge cannot make for profitability. A mental edge in trading is the ability to remain disciplined and execute your price edge as planned (and as many times as possible).
With no price edge, having mental fortitude or mental discipline still means executing randomly but just in a calm fashion. Trading starts when we combine both mental edge and price edge.
Additionally, a mental edge can be aided with automation and algorithms. Utilizing automation is the simplest way to ensure your price edge is executed in a systematic fashion each and every time the edge reveals itself. To learn more about algorithmic trading please check out this full guide: Algorithmic Trading Guide.

Trading Edge, Winning Trades, and the Law of Large Numbers

In the short-term, everything is random. In the long run, things tend to converge toward their expected value (which is our trading edge). This mathematical concept of convergence is known as the law of large numbers.
Many traders fail due to strategy hopping. That is, chasing the new shiny object, the next best strategy.
A terrible trader’s journey that most are on: find a strategy that does well for a while; however, when it starts to struggle either a) tweak it or b) learn some new strategy.
Either option changes the initial strategy aka strategy hopping. This tweaked or new strategy does well live trading for a while but ultimately arrives at another decision point between a) tweaking it again or b) finding a new shiny strategy.
Traders fail to give any strategy time to play itself out. This keeps them in short-term randomness!
The best illustration of short-term randomness and long-term expected value is to view a coin toss over time. Fair coins should land on heads 50% of the time. However, in small amounts of coin tosses we see large variations in the percentages. In only 30 tosses, we saw heads come up 73% of the time and in two other 30 coin toss trials we saw heads come up 43%.
However, after 100 coin tosses the percentages of heads converge toward the expected value of 50%. The law of large numbers is starting to work its magic!
After 10,000 coin tosses the percentages are almost always 50%. Assuming all things remain the same, the law of large numbers is inevitable.

Trading Example of the Law of Large Numbers

This algo strategy below has a remarkably smooth equity curve that most of us would love to see on our brokerage statements. This algo system averaged about $170 in profit per trade.
However, if we track this algorithmic trading strategy’s average trade over time, we can see that in the beginning, when our trust in the trading system is the lowest, it is a rather bumpy ride and far from the $170 per trade edge we wind up with. It takes well over 100 trades for the average trade to converge to the actual average!
Most traders cannot stomach this short-term “randomness” and wind-up abandoning ship to chase a new shiny object, indicator, or “holy grail” strategy.
Traders that fall prey to strategy hopping never let the edge play itself out and sadly never make it. If this is you – stay on the demo account! Trading decisions like this are often missed by other participants and take time to learn.
Some never escape this short-term randomness. My mentor explained this short-term randomness, long-term obviousness concept to me and a lightbulb clicked. Edge plus time is the name of the game
Escaping Randomness was the perfect title of my Chat with Traders interview where I discuss how to overcome randomness and why algorithmic trading can help traders think about edge and risk-taking in a more productive way. If you haven’t already, please check out Aaron’s wonderful work here: Escaping Randomness with David Bergstrom

Trading Edge Ideas and Trading Edge Examples

This blog post would be incomplete without mentioning some simple trading edges and where to begin your search to generate ideas for your own trading edges and limit your own risk.

Time of day trading

many stocks and commodities exhibit strong time of day patterns. For example, the S&P500 has been very strong for day traders from 2 AM ET to 3 AM ET for the last 15-plus years.
Buying one contract in e-mini S&P 500 at 2:00 AM ET and selling one hour later

Seasonality

many stocks show strong seasonal tendencies where repeatable patterns or price movement happens during the same calendar dates year after year.

Price Action

bar patterns and price comparisons can be a strong starting point to identify trading edges. However, always investigate and test thoroughly. Do not be misled by industry given names such as Bearish Engulfing. Read about trading “truths” here.

Relative Value

comparing one asset to another can provide an edge relative to another asset. This can assist non-directional traders, pair traders, and relative value traders with many trades in many markets.

Alternative Data

Using alternative data such as market breadth, economic data, interest rate spreads, Vix term structure, options flows, and more can provide additional areas to amplify or add trading edge to your portfolio.
some available alternative data signals in Build Alpha

Using Build Alpha to enhance Trading Edge

Build Alpha allows you to require entry signals forcing the software to use these required signals on every strategy the genetic algorithm creates. The trader can also select thousands of other non-required signals to combine with any required signals. This process will then find the best complimentary signals for the required trading signals. This can take a known edge and enhance it without much effort or time
Additionally, Build Alpha provides various ways to visualize trading edge for any strategy including e-ratio, monte carlo distributions, equity curves, and heat maps.
Finally, no edge is complete until it passes stress testing. Build Alpha offers the largest suite of robustness tests and checks for algorithmic trading strategies. Robustness testing is an edge of its own as many strategies fail in live markets.
Please check out the full suite here: Robust Trading Strategy Guide.

Need to Knows About Trading Edges

Summary of Edge in Trading

Finding an edge in trading is often the difference between account growth and trading failure. There are two primary sources of edge in trading: information edge and price edge. Information edge consists of insider information or material non-public information. Price edge consists of data analysis and finding opportunities that others are unwilling to take.
The best traders quantify and rank their edges before deciding allocations. Edge Ratio is the best way to quantify and compare trading edges. In the end, finding one setup or trading edge is the key to long-term success in the markets. Creating a process or using software to quickly identify edges can be the difference between growth or trading randomly. Day traders be aware!

Author

David Bergstrom – the guy behind Build Alpha. I have spent a decade-plus in the professional trading world working as a market maker and quantitative strategy developer at a high frequency trading firm with a Chicago Mercantile Exchange (CME) seat, consulting for Hedge Funds, Commodity Trading Advisors (CTAs), Family Offices and Registered Investment Advisors (RIAs). I am a self-taught programmer utilizing C++, C# and python with a statistics background specializing in data science, machine learning and trading strategy development. I have been featured on Chatwithtraders.com, Bettersystemtrader.com, Desiretotrade.com, Quantocracy, Traderlife.com, Seeitmarket.com, Benzinga, TradeStation, NinjaTrader and more. Most of my experience has led me to a series of repeatable processes to find, create, test and implement algorithmic trading ideas in a robust manner. Build Alpha is the culmination of this process from start to finish. Please reach out to me directly at any time.