Build Alpha Features List

Learn how easy it is to build automated trading strategies using Build Alpha’s point and click interface. No programming necessary.

Thousands of Signals

Proprietary Stress Tests

Automatically Generates Code

Features

Output Interface

The output interface allows the trader or money manager to quickly sift through hundreds of generated strategies with the click of a button or arrow keys. Easily navigate the in-sample, out of sample and combined result. View equity curves, drawdowns, and run every strategy through advanced robustness testing capabilities of Build Alpha. The right-hand side of the output interface will be covered in depth below.
Build Alpha Trading Strategy Results Window

Input Interface

Select all your strategy inputs. Symbols, dates, timeframe, entries, exits, risk management, parameter settings, fitness function, and more
Read More

The database consists of over 5,000 signals to choose from. Point and click allows the trader/money manager to throw whatever ideas they have against the wall. Select anywhere from 2 signals to all 5,000+ at once. Create multiple parameter settings and variations of each.

Then hit simulate to let Build Alpha search the millions of possible combinations of strategies to find the best ones. 

Automatic Workflow

Automated Workflows

Set automatic filters based on performance metrics, number of trades, or even pass or failure of specific robustness tests. Only view strategies you want to see. An enormous time saver.

Read More

Traders can now set in-sample, out-of-sample or combined results filters to automatically discard any strategies not meeting their criteria. 

Traders can set performance metric thresholds to ensure strategies have a high enough winning percentage, high enough profit factor, trade frequently enough, etc. 

Additionally, traders can set advanced filters and automate robustness testing. For example, traders can specify the Noise Test to be positive or the Variance Test to be x% of the backtest or various other ideas.

*NEW* Intelligence Report

Build Alpha can now review all your saved strategies and make suggestions to automatically help you improve them. You can run the Intelligence Report from the Brokers menu and any strategies with an IR icon have a suggested improvement. Click on the IR icon to view the suggested modification.

Build Alpha Intelligence Report Equity Curve

Equity Curve and Monte Carlo Equity Curve

View historical strategy performance by date or trade number. Equity curves show how a particular strategy performed during the backtesting period. Red projection bands help set proper expectations and monitor strategy health.
Read More

The blue line in both cases is this specific strategy’s backtested equity curve or cumulative account growth. The red lines in the right graph display a projection of where the equity curve will be in 50 trades into the future with 95% confidence. The red lines are created using a Monte Carlo technique randomly selecting 50 trades from the backtest over 1,000 times and then displaying the 5th and 95th percentile of the results. All these numbers 50, 1000, 5 and 95 can be adjusted by the user to whatever is desired.

It can be said there is a 95% chance of exceeding the lower red line and a 5% chance of exceeding the upper red line.

Traditionally, the Monte Carlo Equity Bands are used as a threshold of when/where a strategy is starting to misbehave and needs to be reevaluated/taken off-line. For example, say live trading starts to perform worse than the lower red band – the red band should have been exceeded in 95% of all possibilities – this means performance is unlikely, uncharacteristic and warrants reevaluation.

Across Markets

Easily test strategies across additional markets, timeframes, and asset classes to identify potentially overfit or lying backtests.
Read More

A major fear of system trading is “over-fitting” the data. That is, finding a trading system that too accurately fits the historical data and will not do well on new, live data.

An easy check against this fear is to validate your strategy across other markets. Build Alpha allows the trader to easily add/view performance across other markets.

Build Alpha Trading Strategies Across Markets Robustness Test

Vs. Random

Easily compare generated strategies vs. strategies generated with random signals to discern whether generated strategies could be found by random chance (curve-fit) or actually possess some edge greater than could be found by random chance.
Read More

The dark blue line is the specific strategy’s equity curve. The blue lines are the top 100 strategies from the real signals. The red lines are the equity curves from the random strategies.

The trader/money manager has the ability to turn off and on the plotting of the real strategies AND the random strategies with the click of a button.

Distribution Comparison

View every fitness function’s distribution to avoid trading strategies from poor distributions. Strong predictive edge should show positive skew compared to the random strategies.
Read More

Robust strategies that possess real trading edge should show a more positive skew and greater mean (average) than the random strategies. This would indicate the signals used to generate the real strategies possess real, predictive power and contain some capture-able edge.

In this example, Profit Factor was the selected Fitness Function. Notice how much stronger the real strategies (blue) are compared to the best random strategies (red).

Edge Ratio

Edge Ratio or E-Ratio measures how much a trade goes in your favor vs. how much a trade goes against you. The x-axis is the number of bars since the trading signal. A higher y-value signifies more “edge” at that step in time. Easily see when trading edges decay and it is time to exit.
Read More

Measurements are normalized for volatility with 1 being the baseline. That is, the y-axis is an expression of how many units of volatility more or against you your trade gets. A measure of 1.2 would indicate 0.2 units more of favorable volatility and a measure of 0.8 would indicate 0.2 units more of adverse movement.

The blue line is for the selected strategy’s signal and the red line is for the best “random” strategy for the same market. The red line is to serve as a baseline to beat.

Strategies with an E-Ratio less than the red baseline can be less confident it will withstand the test of time.

Monte Carlo Tests

Monte Carlo tests are a powerful feature that allows the trader/money manager to set proper expectations around risk and uncertainty. Identify realistic performance paths and drawdown measures prior to risking real capital.
Read More

The purpose is to see how the system would fair assuming a different sequence of trades. This can give insights into the future possible paths the system may experience. Easily view best, worst, and average drawdown from all Monte Carlo Simulations to create better risk expectations moving forward.

Variance Testing

Variance testing is a unique forward simulator to see how well a trading strategy should do over the next N trades with varying win rates. It creates hypothetical equity curves into the future based on the distribution of the backtest results. The trader can predetermine how much to vary the win rate, how many trades into the future to look, and the number of simulations to run.
Read More

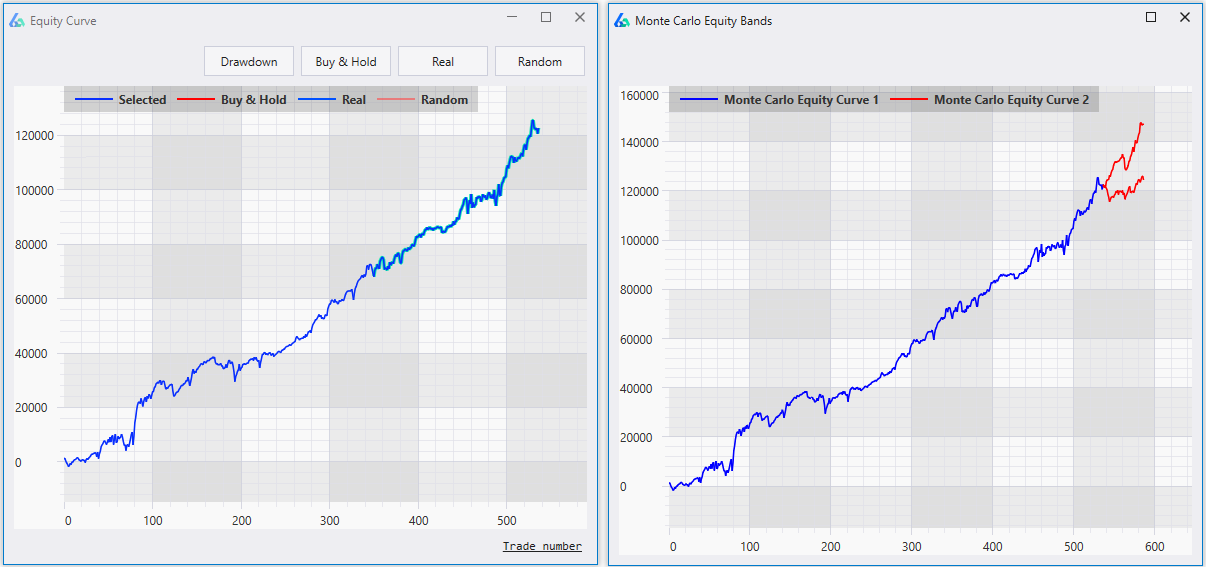
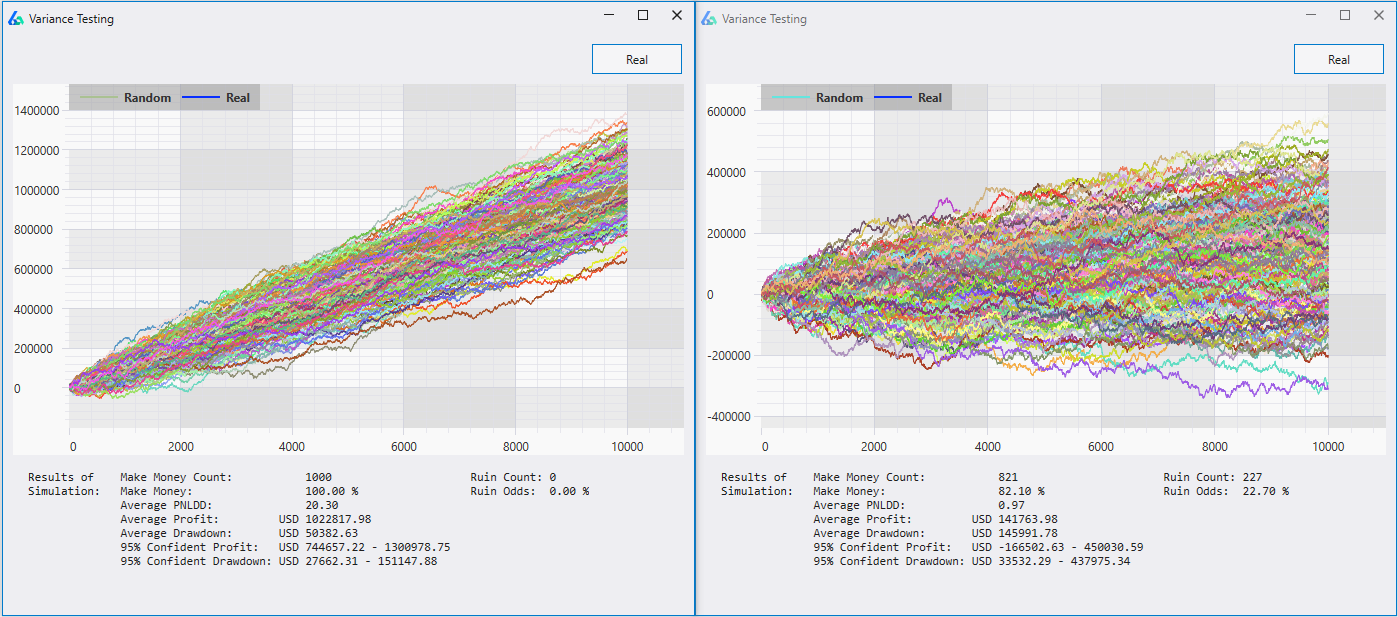
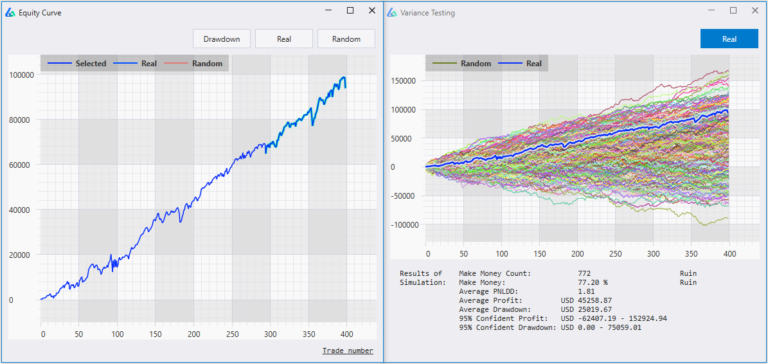
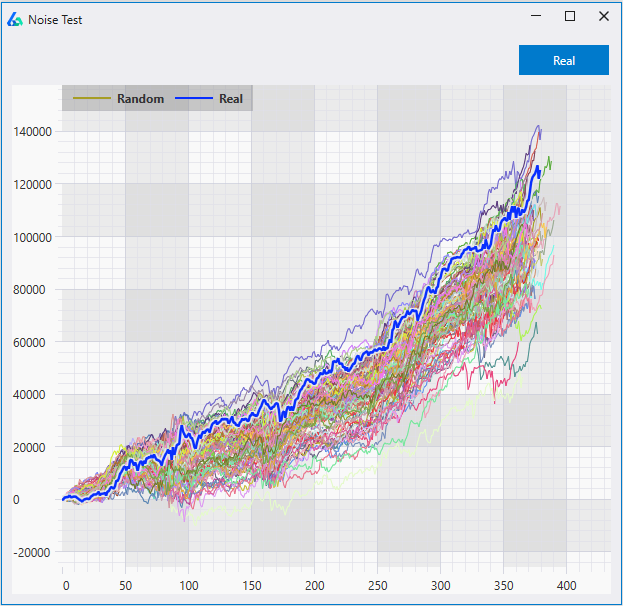
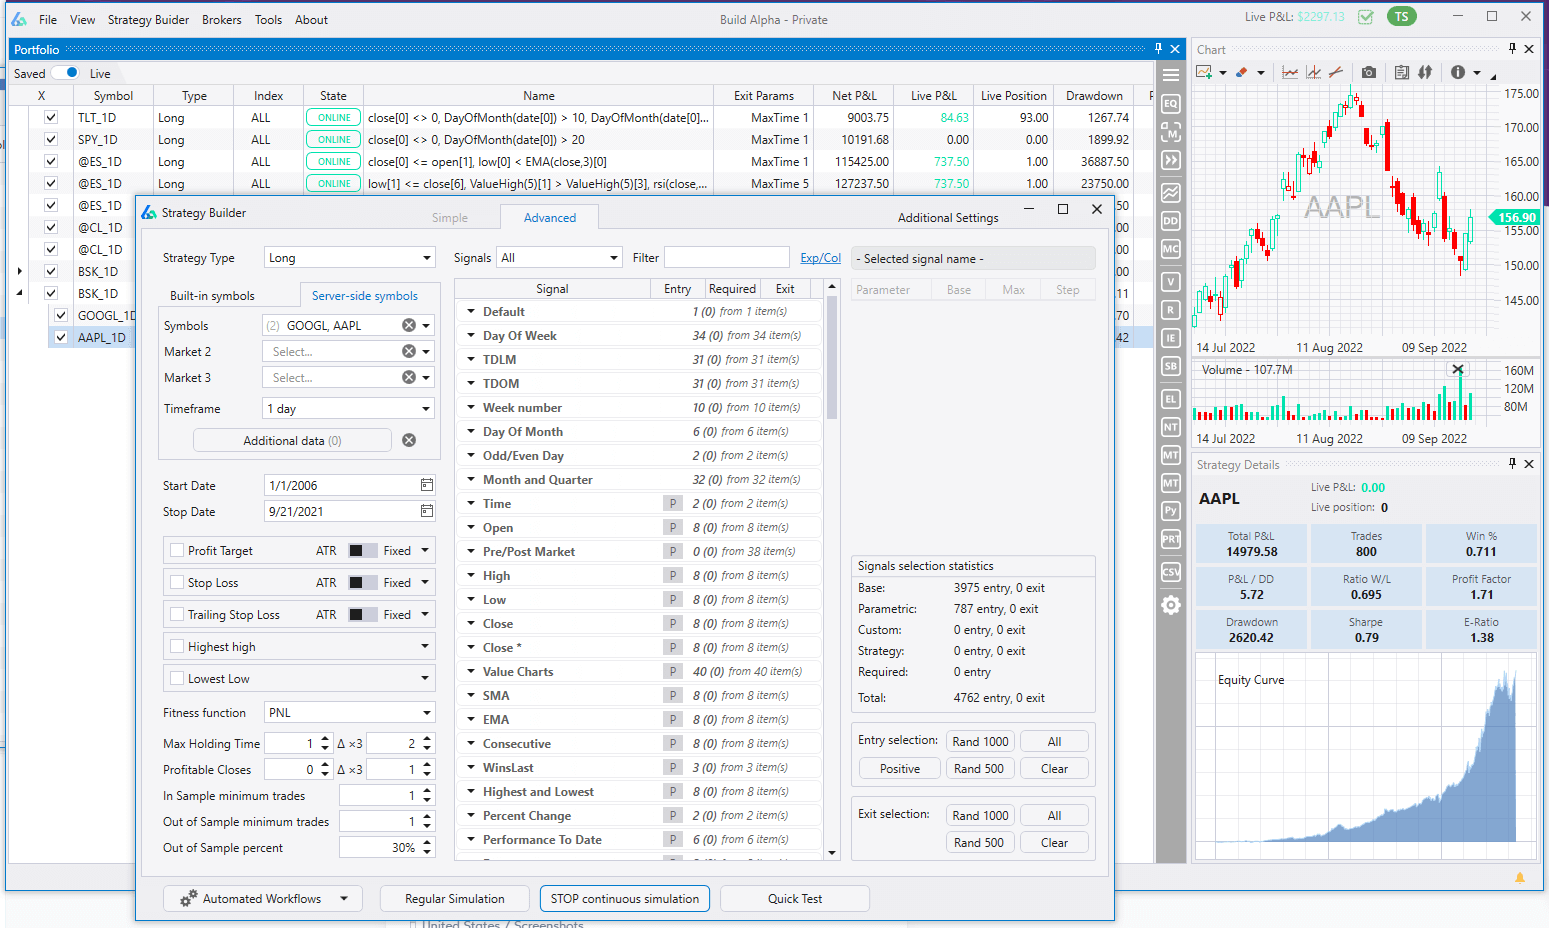
Example of Variance Testing

For example, a trader or money manager can vary his win rate and see how likely a certain strategy is to make $X over the next 100 trades or how likely said strategy is to lose $X over the next 100 trades given a certain fluctuation in the winning percentage.

Setting Realistic Trading Expectations

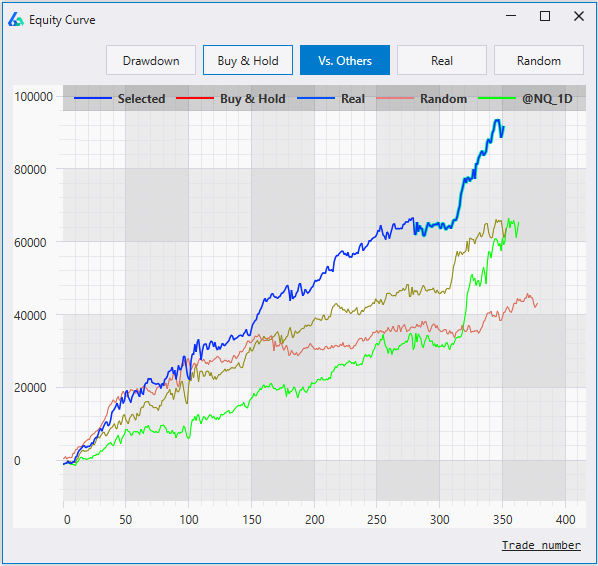
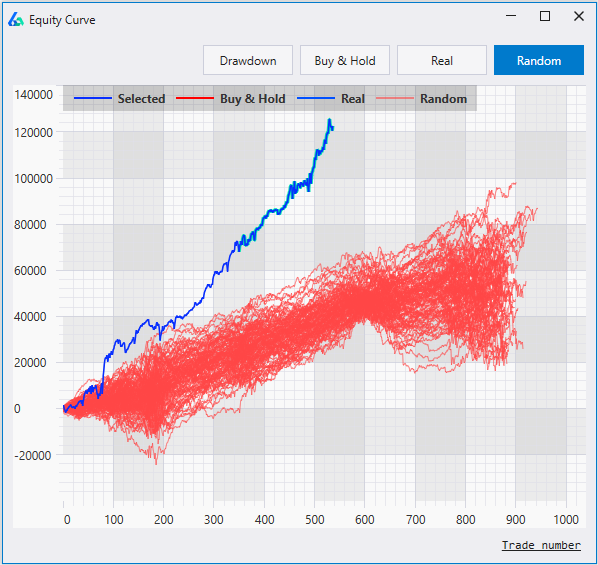
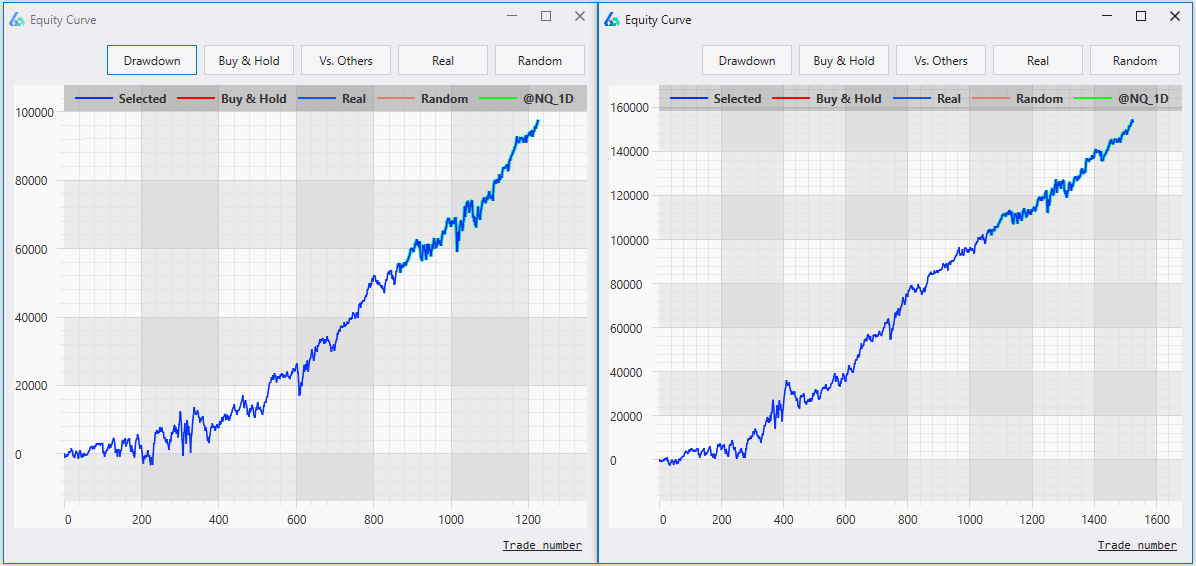
Similarly, one main goal is to prevent clients from saying “all my systems fail when they go live”. The problem may very well be the trader or money manager had unrealistic expectations heading into live trading. For example, did the strategy display a distribution like the one on the left picture above or the distribution like the picture on the right?

If you do not know then you are not prepared and likely will say, “all my systems fail when they go live”. This type of stress testing can help determine if a strategy had an unrealistic backtest or is part of a stable distribution poised to perform near desired expectations moving forward.

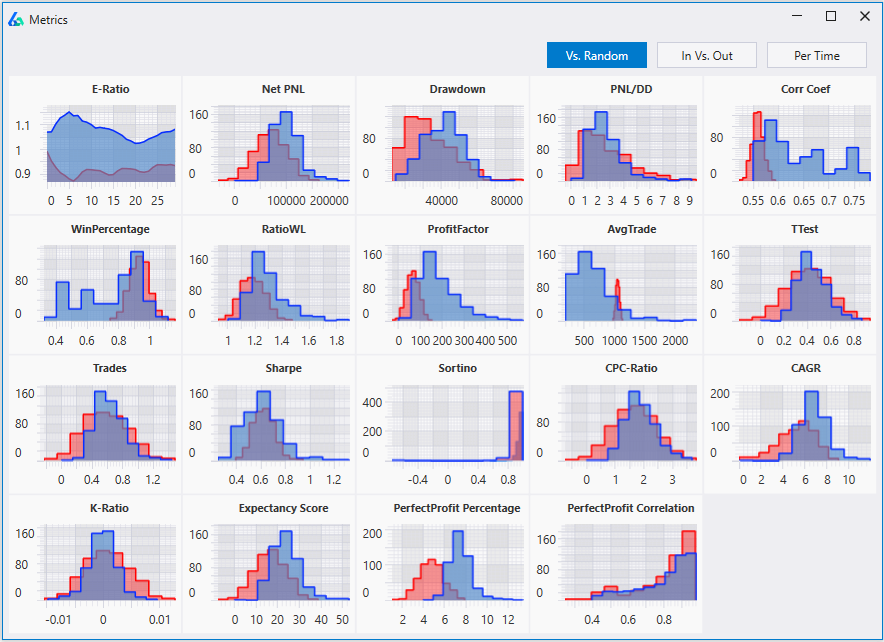
Variance Testing Details

Beneath the graph, Variance Testing also displays

  • likelihood a strategy will be profitable over N trades
  • likelihood it will hit a certain drawdown over N trades
  • average profit and drawdown over X number of simulations
  • 95% confidence interval for both profit and drawdown.

All of these data points can help create better expectations moving forward while helping traders and money managers avoid fatal (and avoidable) mistakes. Build Alpha users can adjust the number of trades looking forward, the number of simulations, the drawdown amount, and the win rate’s variance to build their own custom stress test on every strategy AND portfolio constructed.

Case Study

The left chart’s blue line and the right chart’s blue line are the same backtest results. Alone, the backtest looks like a viable strategy. However, after running the Variance Test, we can conclude these results are unlikely to happen again.
Read More

Expecting to make $100,000 in the next 400 trades (as our backtest did) is highly unlikely; it would be prudent to adjust our expectations or avoid this strategy altogether.

The average profit from our simulation on this strategy was only $45,000 or 45% the backtest’s results! Just another way Variance Testing and Build Alpha can assist the trader and money manager to build alpha (get it).

Noise Test

This test creates 1,000 synthetic price series with altered noise (volatility) and then re-trades the strategy 1,000 times on the new noise adjusted data. Does changing the noise affect strategy performance?
Read More

If the strategy does well on new 1,000 noise adjusted data series then we can be more confident to have found a true signal in the data and not be [over] ‘fitted’ to the noise.

The trader has full control over and can adjust how the noise adjusted data series are created. 

Here are some articles where I expand on Noise Testing:

Intraday Checks

Optimize any intraday trading strategy to find the ideal times of day to trade, maximum or minimum P&L per day, or total amount of trades to take per day.
Read More

The highlighted strategy’s rules will appear at the bottom of the display. This example shows the strategy with the added rules

  • only trading between 2:00 am and 12:00 pm
  • only allowing 2 trades per day
  • stopping trading after a $1,000 loss 

There are distribution plots for total P&L, drawdown, and average trade. These distributions allow us to avoid trading a lucky outlier.

Read more

Equity Curve Trading

Can we improve performance analyzing the patterns in a trading strategy results? Maybe risk-adjusted returns improve by adding an overlay or meta system on top.
Read More

For example, can we achieve smoother risk-adjusted returns by only trading this strategy after the last trade was a loser? How about if the last two trades were losers? What if we only traded this strategy when its equity curve was below the 5-trade moving average of the equity curve?

Meta systems may provide ideas to increase leverage or position sizing when the strategy’s equity curve begins to dip, for example.

Read more

Delayed Entries and Exits

A simple, but often overlooked, robustness test is to delay the entries and/or exits to determine how sensitive a trading strategy may be to these changes.
Read More

Build Alpha allows the trader and money manager to view each and every strategy with a multitude of varying entries and exits. For example, this particular strategy remains profitable while adjusting the entries and exits. Furthermore, this strategy actually has a greater absolute return had we lagged our exit by 3 bars (Entry lag 0 and Exit lag 3).

Live Strategy Monitoring

Connect Build Alpha to various brokers and data providers to monitor real-time strategy positions, live P&L, receive alerts, and tons more for all your saved strategies and portfolios. Connections include TradeStation, Interactive Brokers, and more.

Generated Code

Build Alpha generates code for any strategy for TradeStation, TradingView, MultiCharts, NinjaTrader8, MetaTrader4, MetaTrader5, Python, Interactive Brokers, Pro Real Time and more. Copy and paste to live trade on a simulated or real account.

Build Alpha Generated Code

Seasonality Breakdown

View complete breakdowns of seasonal strengths and weaknesses of any strategy. Uncover seasonal edges to exploit or right-click to Add a Rule to prevent trading during seasonally weak periods.

Advanced Optimization

Optimize parameters and conduct strategy parameter sensitivity analysis. Build Alpha permits adding noise adjusted data into the optimization process to discover more robust parameter settings.
Read More

Zoom in or double click on any area of the 3D Surface plot and Build Alpha will generate trading code for that specific point on the graph in a single click.

Adding Noise Adjusted Data to the optimization process is not available anywhere else, giving Build Alpha traders a distinct advantage.

Read more

Mean Variance Analysis

Mean variance optimization allows the trader to discover optimal weights in order to optimize your portfolio’s risk adjusted return or Sharpe Ratio. Answer the question, “does this strategy improve my portfolio?”
Read More

The trader or money manager can scroll over the points on the graph and view the individual weights given to each strategy to create that specific point.

The highlighted red point is the result of the using even weights on each strategy in the portfolio.

Read more

Correlation Matrix

The Correlation Matrix allows traders the ability to view how correlated individual strategies have been. This gives the trader or the money manager the ability to construct portfolios of uncorrelated strategies.
Read More

The correlations are calculated using marked to market daily returns. This is an industry standard method and allows Build Alpha to compare/contrast strategies of different styles, holding periods, and exits.

The Holy Grail of trading and investing is combining uncorrelated return streams. 

Randomized Out of Sample Testing

Out of Sample Testing can be easily passed when the underlying data exhibits a strong trend during the out of sample period. Randomized out of sample presents a solution for this pitfall.
Read More

Randomized Out of Sample testing is a simple check that a strong trend in our out of sample test period did not contribute too greatly to our favorable out of sample results. 

Randomized Out of Sample testing runs 1,000 tests where each iteration selects random, non-continuous data points to serve as our out of sample period. This ensures we do not have a strong trend or pattern in our out of sample period that allowed a weak strategy to pass out of sample testing. It also allows us to view a distribution of outcomes vs. a single backtest’s out of sample results.

Read more

Ensembles and Hedging

Strategies that use other strategies as input signals. Create voting systems among your portfolio strategies to reduce overfitting and smooth performance.
Read More

Assume you have 5 Crude Oil strategies; however, it may be better to only take a position when 3 of the 5 are in agreement. Build Alpha can now check and find out if improvements can be had when 2, 3, 4 or 5, etc. are in agreement. Build Alpha can check thousands of systems, if desired.

Ensemble approaches are widely agreed to be a superior approach (with evidence to back it up) to most machine learning, prediction, and data science problems.

Read more

Rebalance Strategies

Rank your symbol universe and only apply your strategy to the top (or bottom) ranked symbols.
Read More

Rebalance strategies rank a universe of symbols on a specific criterion and then enter positions in the top ranked (or bottom ranked) symbols on the rebalance date, then re-rank the universe of symbols at the next rebalance date and adjust the positions accordingly.

These strategies do not need a specific entry or exit signal; however, you can use entry and exit signals to provide a strategy overlay on top of the rebalance logic.

For example, we have the Dow 30 stocks as our universe and want to trade the top 5 each month based on last month’s performance. We can buy and hold for the entire month, rebalancing into the next top 5 the following month. We can also find which are the top 5 symbols each month and then apply a strategy to only these 5 symbols for the duration of the month, re-ranking at the start of the next month and the only apply the strategy to the current month’s top 5 symbols. Build Alpha can test and find the best ranking method, rebalance period and number of symbols to trade in the universe.

Read more

Regime Switching Models

Most strategies go flat when there is no trading signal. Build Alpha enables traders to test parking free cash in another asset until a new trading signal is generated.
Read More

The graph on the left goes long the S&P500 when the market enters into a bullish regime. When the market enters into the bearish regime most long trading systems go flat.

However, Build Alpha allows you to test the same trading idea but invest in a second market instead of being flat. 

The graph on the right shows the equity curve going long the S&P500 when the market enters into a bullish regime and going long US 10 Year Note Futures when the market enters into the bearish regime.

NO other software or platform allows users to create market regime switching strategies.

Signal Breakdown

Learn what signals occur most often during winning or losing trades to better modify and adjust your trading strategies.
Read More

Signals that occur much more frequently on losing trades are good candidates to exclude while signals that occur more frequently on winning trades may be good to add to your trading strategy. 

How come Build Alpha does not find these signals in the strategy building process? It does! But the user can limit the number of rules Build Alpha uses per strategy to avoid potentially over-fitting.

After viewing the Signal Breakdown, the trader can right-click on any strategy and choose to add additional rules.

Of course all of this is done with NO programming – all point and click.

Create Custom Signals

Build Alpha has over 5,000 entry and exit signals – all point and click. However, you can now add your own signals to test using the signal editor or python.
Read More

There are two ways you can create and add custom signals to the Build Alpha strategy engine.

First, you can use the drag and drop signal editor to create your own custom signal or rule. 

Second, you can create any custom signal using python. You can use any and all python libraries to create custom signals and then pass them into the strategy engine. 

All custom signals can be used in combination with any of the other custom or built-in signals. 

Read more